


China Index Research Institute: In the first half of the year, rents for stores in major commercial streets and key business districts in China continued to decline slightly
The Zhitong Finance App learned that the China Index Research Institute published an article stating that according to survey data, in the first half of 2026, rents in major shopping districts and key business districts (shopping centers) in China will continue to decline slightly. Among them, the average rent for 100 shopping street stores in key cities across the country was 23.87 yuan/square meter/day, down 0.76% from month to month; the average rent for 100 shopping mall stores with 100 typical shopping center stores as sample targets was 26.90 yuan/square meter/day, down 0.36% from month to month.
In terms of the number of increases and decreases, among the sample shopping districts, shopping streets where rents fell month-on-month accounted for 81.5%, and those with month-on-month increases in rents accounted for 18.5%; among the sample business districts (shopping centers), business districts where rents fell month-on-month accounted for 85.3%, and business districts where rents rose month-on-month accounted for 13.7%, and 1.1% of commercial district rents were the same as in the previous period.
Overall, in the first half of 2026, new supply in key cities decreased slightly compared to the same period last year. Among them, most of the new construction projects were located in emerging business districts, and the core business district of the city was mainly stock renovation projects. Overall demand for retail leasing is weak, investment pressure for projects is increasing, and rents continue to decline in most shopping streets and business districts.
1. 100 Street Shop Rent Index
(1) Rent change: The average rent for Baijie stores in the first half of 2026 was 23.87 yuan/square meter/day, down 0.76% from the previous month
Figure: Average rents and month-on-month changes in major commercial streets in key cities across the country from 2018 to 2026
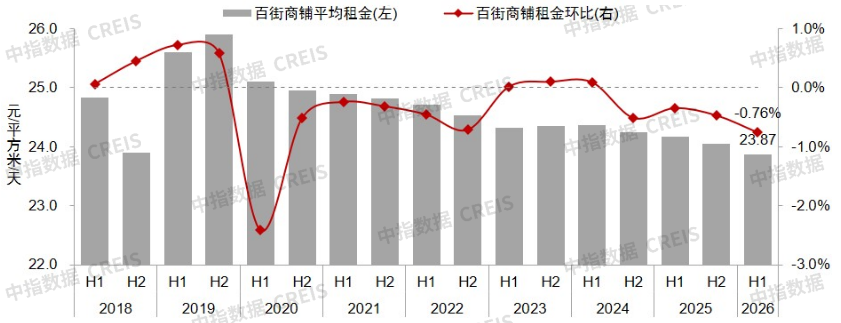
In the first half of 2026, experiential consumption and service consumption remained resilient. Cultural tourism consumption heated up, and inbound tourism was active, driving a slight increase in rents for a few landmark shopping streets located in the core area of the city and mainly in experiential business formats such as cultural tourism and catering. At the same time, some commercial districts are actively undergoing renovation and upgrading, improving the consumer experience, and providing some support for rent increases. However, against the backdrop of a slowdown in retail sales growth, most shopping streets have weakened passenger flow and the rental capacity of merchants, and rents have declined. According to survey data from a sample of stores in major shopping streets in 15 key cities across the country, 100 shopping street stores in key cities were sampled to form the 100 Shopping Street (100 Street) Store Rent Index. In the first half of 2026, the average rent for Baijie stores was 23.87 yuan/square meter/day, down 0.76% month-on-month, and 0.29 percentage points higher than in the second half of 2025.
(2) Commercial street performance: 81.5% of sample commercial street rents fell month-on-month, with relatively large declines in Chengdu Yipin Tianxia and Zhongshan Road in Haikou
In the first half of 2026, shopping streets with month-on-month rents fell 65.4% of the first-tier city sample shopping streets, and 34.6% of the shopping streets with month-on-month rents; among the sample shopping streets in second-tier cities, 92.3% of commercial streets with month-on-month rents fell, and 7.7% were shopping streets with month-on-month increases in rents.
Figure: Shopping streets with large month-on-month rent increases and decreases in the first half of 2026
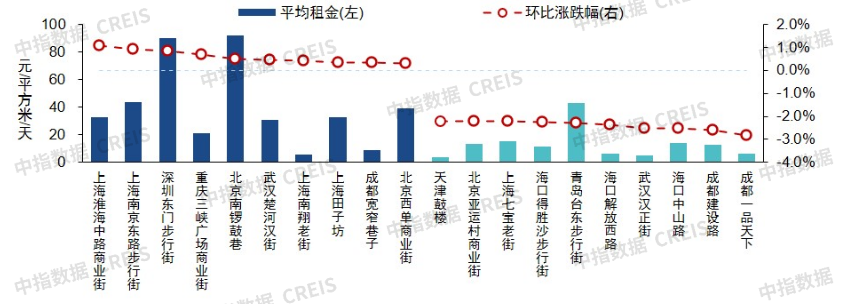
In the first half of 2026, 81.5% of sample shopping street rents fell month-on-month. Specifically, rents for 13 commercial streets including Chengdu Yipintianxia and Haikou Zhongshan Road fell by more than 2.0%; rents for 18 commercial streets including North Sichuan Road in Shanghai, Hefang Street in Hangzhou, Shilou Pedestrian Street, and Haikou Qilou Old Street fell between 1.0%-2.0%. Rents for 13 commercial streets including Suzhou Xietang Old Street, Tianjin Xiaobailou Shopping Street, Qingdao Licun Shopping Street, and Chunxi Road in Chengdu fell between 0.5% (inclusive) -1.0%, and 9 commercial streets including Tianjin Wudao Shopping Street and Beijing Houhai Bar Street The decline was within 0.5%. Rents in the sample shopping street rose 18.5% month-on-month. Among them, Shanghai's Huaihai Middle Road Shopping Street saw the biggest increase of 1.07%; rent increases for 4 shopping streets, including Nanjing East Road Pedestrian Street in Shanghai and Dongmen Pedestrian Street in Shenzhen, were between 0.5%-1.0%, while rents in 7 commercial streets, including Han Street in Chuhe in Wuhan and Kuanzhai Alley in Chengdu, rose less than 0.5%.
2. 100MALL Store Rental Index
(1) Rent change: The average rent for Baimall stores in the first half of 2026 was 26.90 yuan/m2/day, down 0.36% from the previous month
Figure: Average rents and changes in major business districts (shopping centers) in key cities across the country from 2018 to 2026
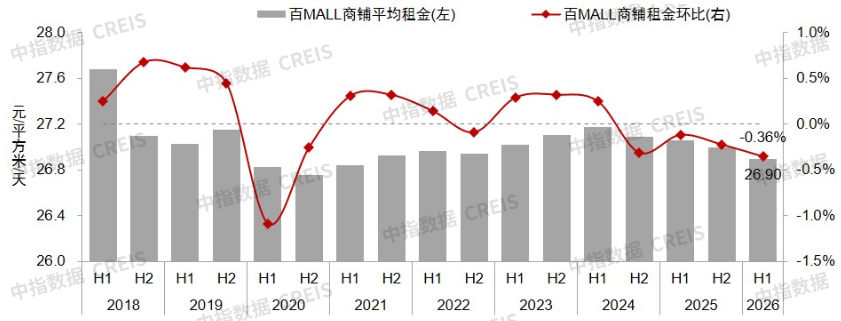
In the first half of 2026, retail sales growth slowed. Only a few high-energy business districts located in the core area relied on the brand energy level and passenger flow appeal of benchmark projects, and rents rose slightly; most business districts were affected by oversupply, project aging, and homogenized competition. Passenger flow declined, merchant rental capacity weakened, and rents continued to decline. According to survey data of typical shopping center store rental samples in 15 key cities across the country, 100 typical shopping center stores in key cities were used as sample targets to form the top 100 shopping malls (100 MALL) store rent index. In the first half of 2026, the average rent for 100 Mall stores was 26.90 yuan/square meter/day, down 0.36% from the previous month, and the decline was 0.14 percentage points higher than in the second half of 2025.
(2) Business district performance: Rents in the sample business district fell by 85.3% month-on-month, while business districts such as Tianjin Meijiang and Haikou Jiefangxi declined significantly
In the first half of 2026, 88.6% of business district (shopping center) rents in first-tier cities fell month-on-month, and 11.4% of commercial district (shopping center) rents rose month-on-month; in second-tier cities, 82.4% of business district (shopping center) rents fell month-on-month, 15.7% of commercial district (shopping center) rents rose month-on-month, and 2.0% business district (shopping center) rents remained the same as the previous period.
Figure: Business districts with large month-on-month rent increases and decreases in the first half of 2026
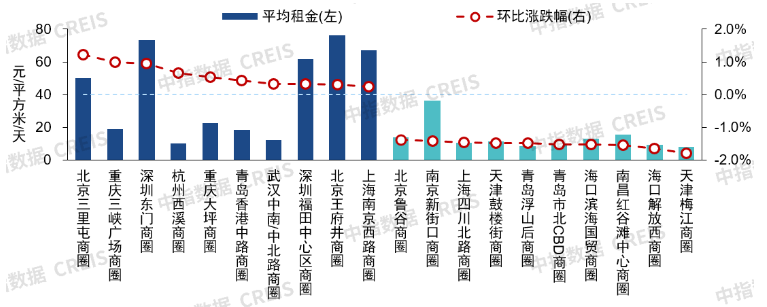
In the first half of 2026, 85.3% of the sample business district (shopping center) rents fell month-on-month. Specifically, rents in 19 business districts (shopping centers), including Tianjin Meijiang, Haikou Jiefang West, Nanchang Honggutan Center, and Qingdao North CBD, fell by more than 1.0%; 25 business districts (shopping centers) including Suzhou Guanqian Street, Shenzhen Nanshan Central District, Hangzhou Wushan, and Qingdao Licun fell between 0.5%-1.0%; and 37 business districts (shopping centers) including Shanghai Zhenru, Beijing Gongzhufen, Chengdu Yanshikou, and Tianjin Nanshi fell within 0.5%. Rents in the sample business district (shopping center) rose 13.7% month-on-month. Specifically, rents in Beijing's Sanlitun and Chongqing's Three Gorges Plaza business districts increased by more than 1.0% (inclusive), while rents in the three business districts of Dongmen in Shenzhen, Xixi in Hangzhou, and Daping in Chongqing rose between 0.5%-1.0%, while rents in eight business districts (shopping centers), including the Qingdao Hong Kong Middle Road business district and the Wuhan Zhongnan/Zhongbei Road business district, increased within 0.5%. Rents in the Wangjiawan business district in Wuhan were the same as in the previous period.
3. Supply trend: incremental construction continues to slow down, four newly opened retail businesses have become stock renovation projects, and pure commercial land transactions have declined
(1) Inventory of retail commercial projects: Nearly 2,550 projects* have been opened in 15 cities*, with a total area of about 220 million square meters
*The inventory and incremental statistics described in this article are all centralized businesses with a commercial construction area of 30,000 square meters or more.
Figure: Construction area and number of retail and commercial projects opened in 15 key cities as of June 2026
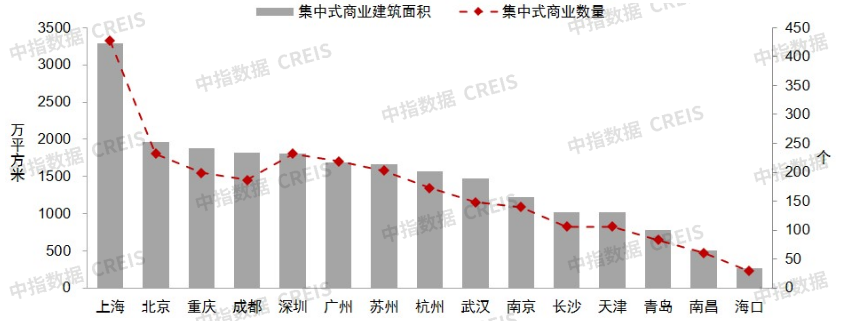
According to data from the China Index, as of June 2026, the total number of retail commercial projects of 30,000 square meters or more opened in the 15 cities monitored by the store rent index is nearly 2,550, with a total construction area of about 220 million square meters. Among them, nearly 430 projects have been opened in Shanghai, with a total construction area of nearly 33 million square meters, the largest inventory; Beijing, Chongqing, Chengdu, Shenzhen, Guangzhou, Suzhou, and Hangzhou have a total construction area of 15 to 20 million square meters, Wuhan, Nanjing, Changsha, and Tianjin between 10 and 15 million square meters, and the total construction area of the opened projects in Qingdao, Nanchang and Haikou is less than 10 million square meters.
(2) Newly opened retail commercial projects: The volume of newly opened projects in 15 cities decreased by 10% year-on-year in the first half of 2026, and 4 became stock renovation projects
In the first half of 2026, there was a slight increase in the number of new retail commercial projects opened in 15 cities, but the operating area decreased, the share of second-tier cities increased, and stock transformation became an important source of new opening projects. According to data from the China Index, in the first half of 2026, the retail rent index focused on monitoring 48 new projects in 15 cities, an increase of 4 over the same period last year. The operating area was about 2.94 million square meters, a decrease of 9% over the previous year. Of these, 19 projects were stock renovation projects, accounting for 40%, an increase of 10 percentage points over the same period in 2025. In terms of opening pace, January and April are the peak opening times, with more than 10 projects being opened. Compared with the peak opening in the first half of 2025, which was concentrated in May and June, the peak opening in the first half of 2026 was earlier.
Figure: Number of retail and commercial projects opened in 15 key cities in the first half of 2026
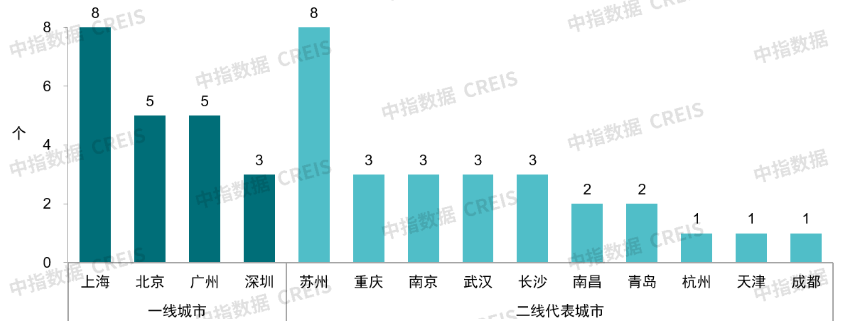
By city level, 21 new retail and commercial projects were opened in first-tier cities, a decrease of 4 compared with the same period last year. The operating area was about 1.5 million square meters, a decrease of 30% over the previous year. The number of newly opened retail commercial projects in second-tier representative cities was 27, an increase of 8 over the same period last year. The operating area was about 1.44 million square meters, an increase of 35% over the previous year.
By city, in the first half of 2026, the largest number of newly opened retail business projects in Shanghai was 800,000 square meters; Suzhou, Guangzhou, and Beijing were between 30-450,000 square meters; Chongqing, Nanjing, Wuhan, Changsha, Nanchang, and Hangzhou were between 100,000 and 250,000 square meters; and Shenzhen, Qingdao, Tianjin, and Chengdu were within 100,000 square meters. Haikou has not detected more than 30,000 square meters of newly opened retail business projects.
(3) Commercial land: Overall commercial land transactions in 15 cities have declined sharply in the past five years, and the incremental development of retail businesses may continue to slow down in the future
Starting from the first half of 2022, the overall scale of pure commercial land transactions in key cities (city-level) has declined sharply, and it is expected that new development projects may continue to decline in the future. In the first half of 2026, the planned construction area of pure commercial land transactions in 15 key cities (city-level) was 5.444 million square meters, a year-on-year decrease of 34%. The total volume was low in nearly 10 years, only 25% of the high point (first half of 2020). Among them, the transaction area of first-tier cities was 1,569,000 square meters, a slight decrease of 1.7% year on year; second-tier representative cities had a transaction area of 3.835 million square meters, a year-on-year decrease of 41.2%.