


Ford (NYSE:F) Misses Q2 CY2026 Revenue Estimates, But Stock Soars 6.6%
Automotive manufacturer Ford (NYSE:F) missed Wall Street’s revenue expectations in Q2 CY2026, with sales falling 3.8% year on year to $48.3 billion. Its non-GAAP profit of $0.42 per share was 21.3% above analysts’ consensus estimates.
Is now the time to buy Ford? Find out by accessing our full research report, it’s free.
Ford (F) Q2 CY2026 Highlights:
- Revenue: $48.3 billion vs analyst estimates of $49.6 billion (3.8% year-on-year decline, 2.6% miss)
- Adjusted EPS: $0.42 vs analyst estimates of $0.35 (21.3% beat)
- Adjusted Operating Income: $2.5 billion vs analyst estimates of $2.10 billion (5.2% margin, 19.2% beat)
- Operating Margin: 1.3%, in line with the same quarter last year
- Free Cash Flow Margin: 4.1%, down from 8.4% in the same quarter last year
- Sales Volumes fell 12.3% year on year (3.8% in the same quarter last year)
- Market Capitalization: $58.5 billion
Company Overview
Established to make automobiles accessible to a broader segment of the population, Ford (NYSE:F) designs, manufactures, and sells a variety of automobiles, trucks, and electric vehicles.
Revenue Growth
A company’s long-term performance is an indicator of its overall quality. Any business can have short-term success, but a top-tier one grows for years. Over the last five years, Ford grew its sales at a mediocre 6.6% compounded annual growth rate. This fell short of our benchmark for the industrials sector and is a poor baseline for our analysis.
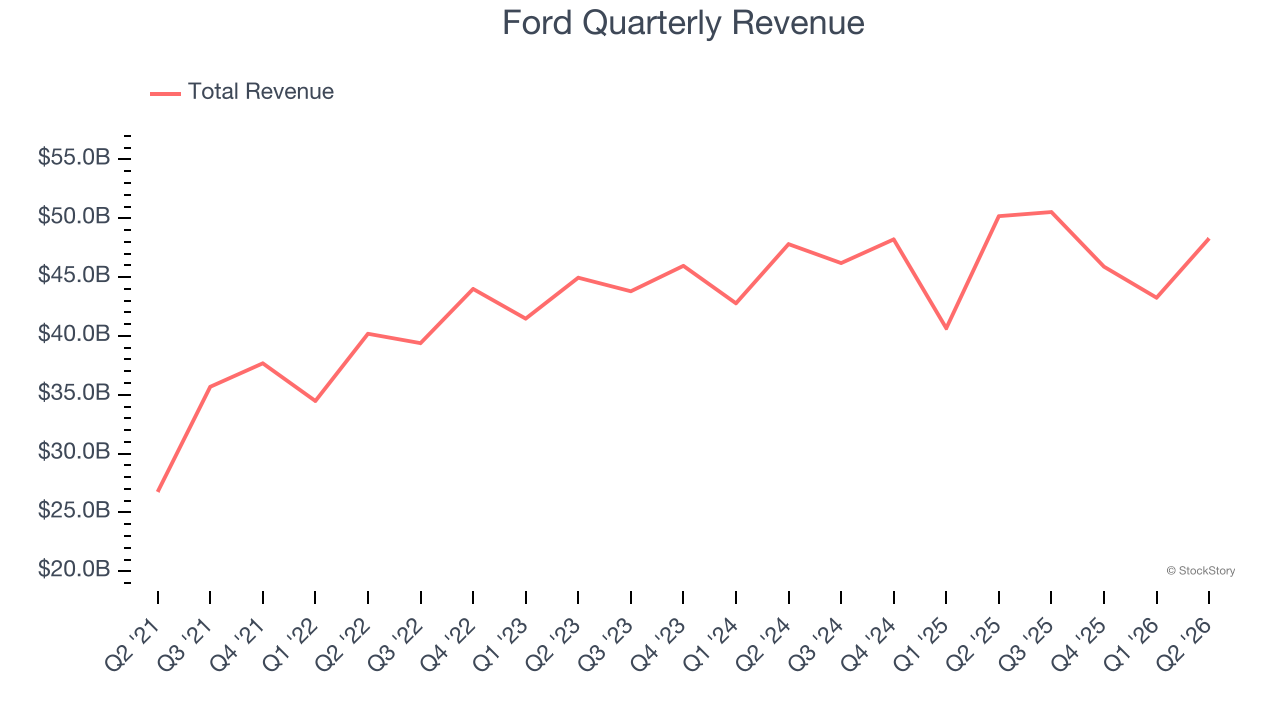
We at StockStory place the most emphasis on long-term growth, but within industrials, a half-decade historical view may miss cycles, industry trends, or a company capitalizing on catalysts such as a new contract win or a successful product line. Ford’s recent performance shows its demand has slowed as its annualized revenue growth of 2.1% over the last two years was below its five-year trend. We’re wary when companies in the sector see decelerations in revenue growth, as it could signal changing consumer tastes aided by low switching costs. 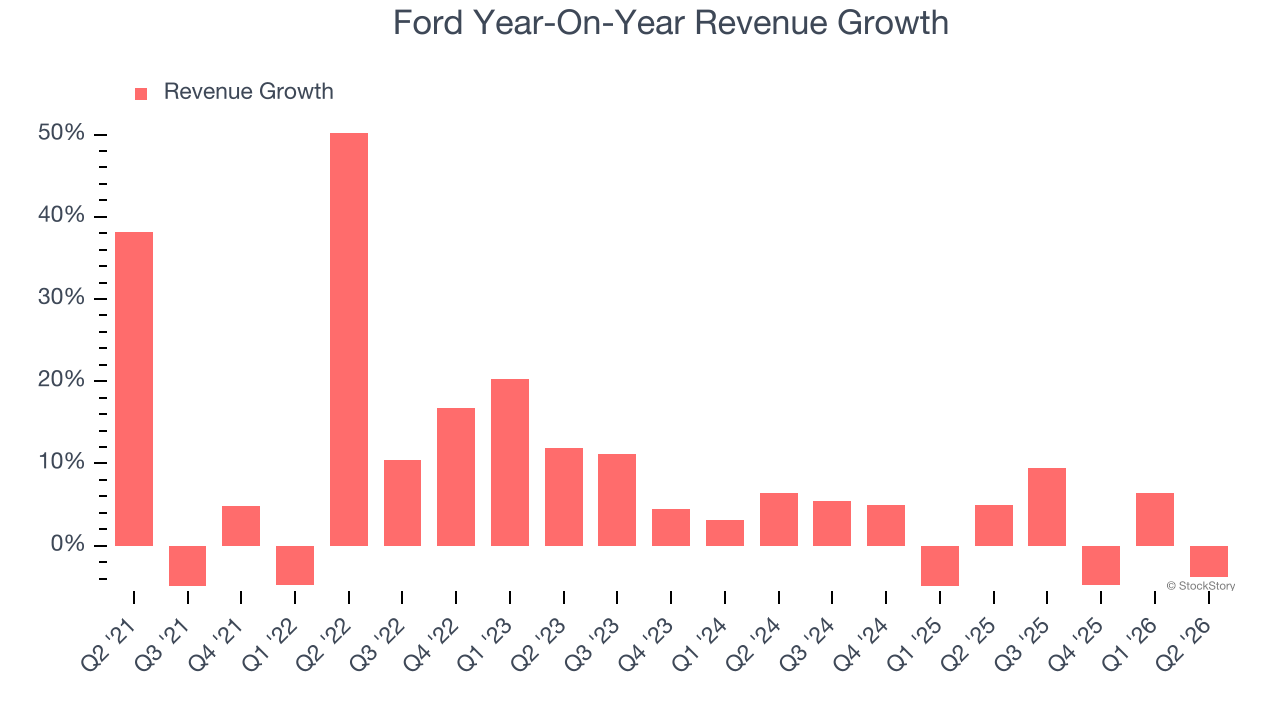
We can better understand the company’s revenue dynamics by analyzing its number of vehicles sold, which reached 1.04 million in the latest quarter. Over the last two years, Ford’s vehicles sold averaged 3.1% year-on-year declines. Because this number is lower than its revenue growth, we can see the company benefited from price increases. 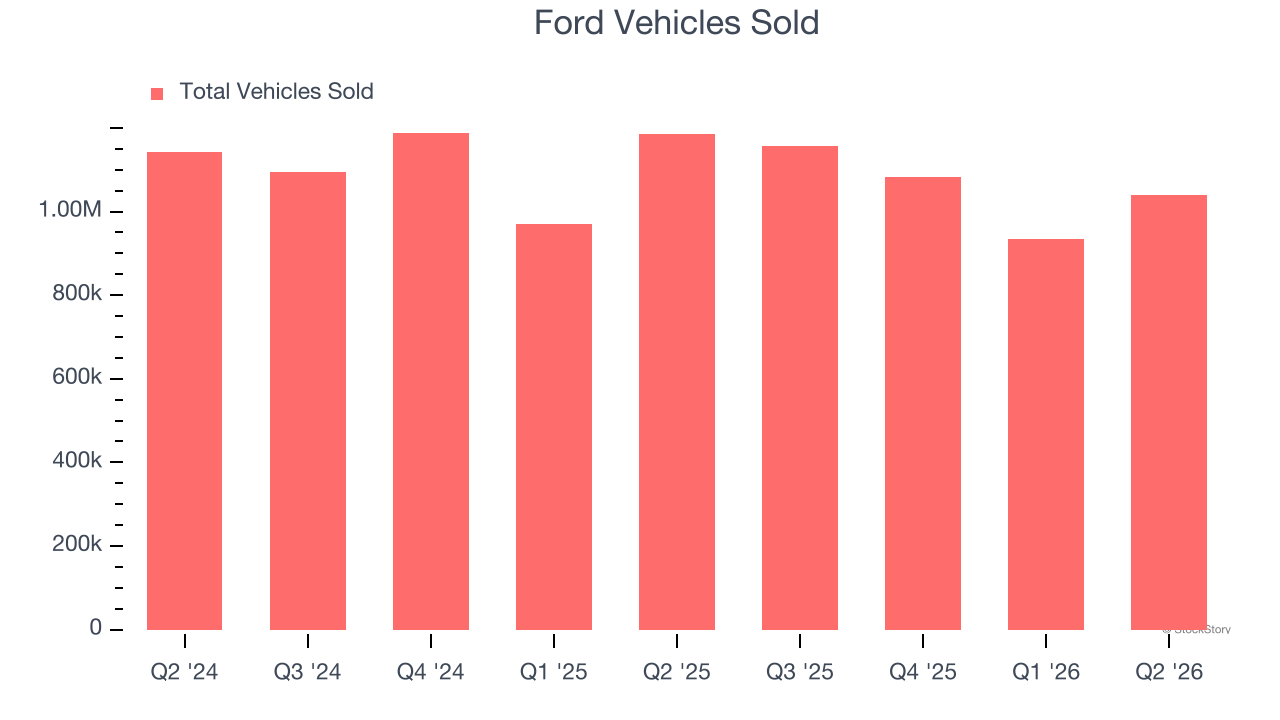
This quarter, Ford missed Wall Street’s estimates and reported a rather uninspiring 3.8% year-on-year revenue decline, generating $48.3 billion of revenue.
Looking ahead, sell-side analysts expect revenue to grow 3.7% over the next 12 months. While this projection indicates its newer products and services will catalyze better top-line performance, it is still below the sector average.
ONE MORE THING: 3 Hidden Platforms Growing 3X Faster than Amazon, Google, and PayPal. Amazon, Google, and Meta all followed the same playbook: Dominate an ignored market. Build an unbeatable moat. Scale until you’re unstoppable.
These three platforms are running that exact playbook right now. The early investors in Amazon made fortunes. The early investors in these could do the same. Get All 3 Stocks Here for FREE.
Operating Margin
Operating margin is one of the best measures of profitability because it tells us how much money a company takes home after procuring and manufacturing its products, marketing and selling those products, and most importantly, keeping them relevant through research and development.
Ford was profitable over the last five years but held back by its large cost base. Its average operating margin of 1.5% was weak for an industrials business. This result isn’t too surprising given its low gross margin as a starting point.
Looking at the trend in its profitability, Ford’s operating margin decreased by 8 percentage points over the last five years. This raises questions about the company’s expense base because its revenue growth should have given it leverage on its fixed costs, resulting in better economies of scale and profitability. Ford’s performance was poor no matter how you look at it - it shows that costs were rising and it couldn’t pass them onto its customers.
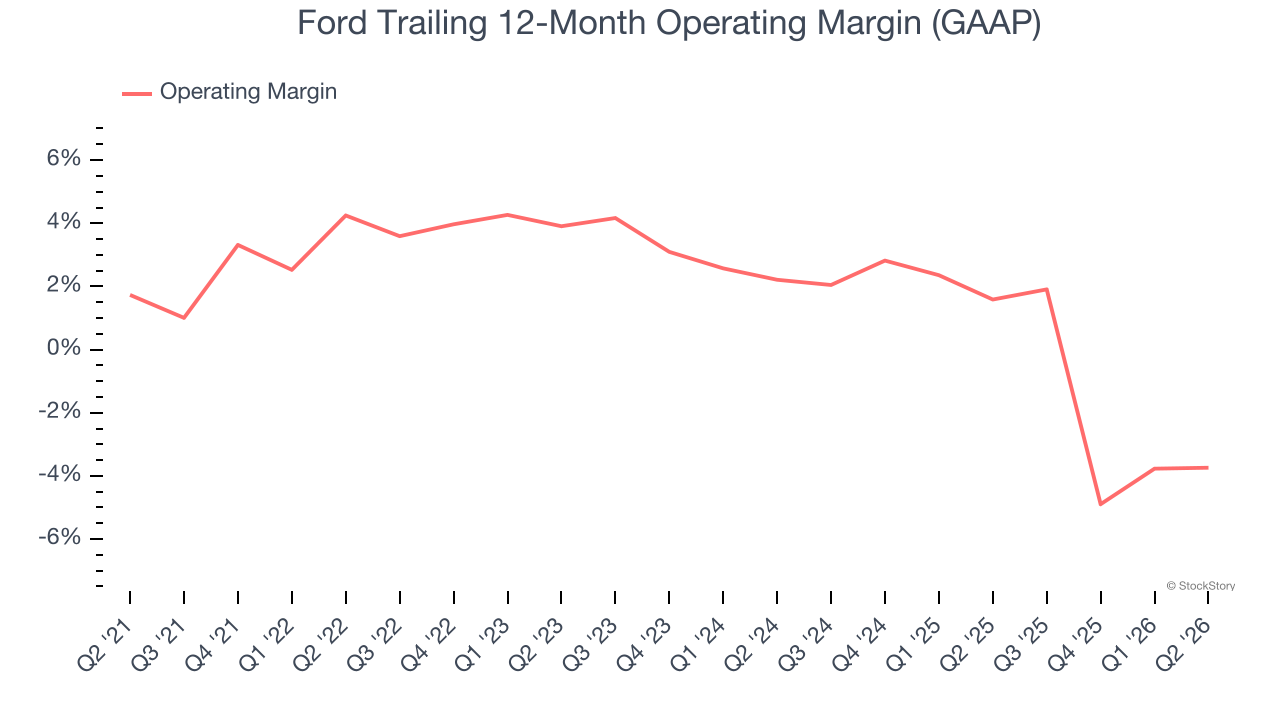
This quarter, Ford generated an operating margin profit margin of 1.3%, in line with the same quarter last year. This indicates the company’s cost structure has recently been stable.
Earnings Per Share
We track the long-term change in earnings per share (EPS) for the same reason as long-term revenue growth. Compared to revenue, however, EPS highlights whether a company’s growth is profitable.
Sadly for Ford, its EPS declined by 3.8% annually over the last five years while its revenue grew by 6.6%. We can see the difference stemmed from higher interest expenses or taxes as the company actually improved its operating margin and repurchased its shares during this time.
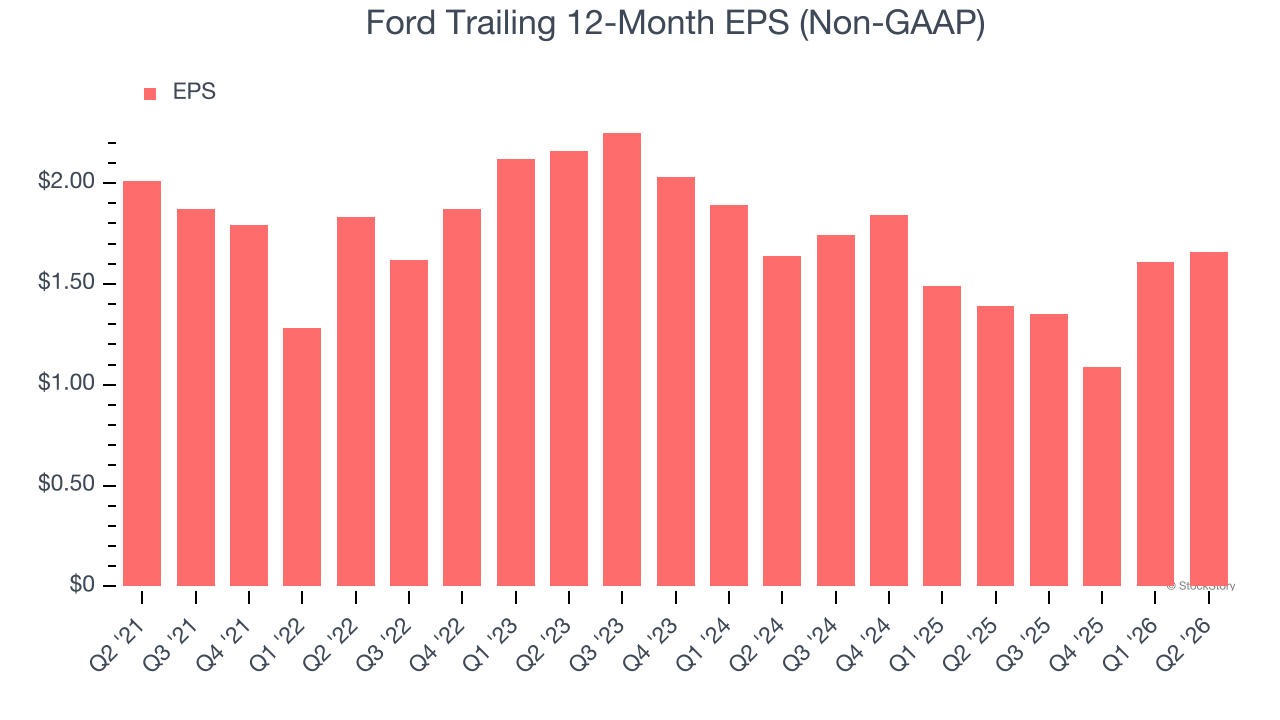
We can take a deeper look into Ford’s earnings to better understand the drivers of its performance. As we mentioned earlier, Ford’s operating margin was flat this quarter but declined by 8 percentage points over the last five years. This was the most relevant factor (aside from the revenue impact) behind its lower earnings; interest expenses and taxes can also affect EPS but don’t tell us as much about a company’s fundamentals.
Like with revenue, we analyze EPS over a shorter period to see if we are missing a change in the business.
For Ford, EPS didn’t budge over the last two years, but at least that was better than its five-year trend. We hope its earnings can grow in the coming years.
In Q2, Ford reported adjusted EPS of $0.42, up from $0.37 in the same quarter last year. This print easily cleared analysts’ estimates, and shareholders should be content with the results. Over the next 12 months, Wall Street expects Ford’s full-year EPS to shrink by 2.5% from $1.66 to $1.62.
Key Takeaways from Ford’s Q2 Results
We were impressed by how significantly Ford blew past analysts’ adjusted operating income expectations this quarter. We were also glad its EPS outperformed Wall Street’s estimates. On the other hand, its revenue missed. Overall, this print had some key positives. The stock traded up 6.6% to $15.97 immediately following the results.
Ford may have had a good quarter, but does that mean you should invest right now? We think that the latest quarter is only one piece of the longer-term business quality puzzle. Quality, when combined with valuation, can help determine if the stock is a buy. We cover that in our actionable full research report which you can read here (it’s free).