


Genesis Energy (GEL) Raises Its Cash Distribution, Where Does Fair Value Sit?
Genesis Energy (GEL) has drawn fresh attention after its board approved a higher cash distribution for the second quarter of 2026, including a 21.2% increase in the payout to common unit holders.
See our latest analysis for Genesis Energy.
At a share price of $14.82, Genesis Energy has seen its 30 day share price return climb 5.03%, even though the 90 day share price return is down 13.33% and the 1 year total shareholder return is down 1.94%. Longer term total shareholder returns over 3 and 5 years remain strong, which suggests the recent distribution increase is landing on a stock where long term momentum has been positive but has cooled in recent months.
If the latest move from Genesis Energy has you thinking about other income and infrastructure ideas, it could be a good moment to check out 35 power grid technology and infrastructure stocks.
The higher distribution, recent share price pullback and the gap between Genesis Energy’s US$14.82 unit price and published value estimates all point to the same tension. Where does fair value really sit now for this stock?
Preferred Price to Sales Multiple for Genesis Energy: Is it justified?
For Genesis Energy, the clearest anchor right now is its P/S ratio of 1.1x. That sits alongside a last close of $14.82 and a wide range of other valuation signals.
The P/S multiple compares the company’s market value to its revenue. For a midstream energy partnership like Genesis Energy, where profits can be lumpy and net income is currently a loss of $22.72m on revenue of $1.68b, this ratio can sometimes give a cleaner read than earnings based measures.
On one hand, Genesis Energy looks inexpensive relative to peers and the wider US Oil and Gas industry. The current 1.1x P/S ratio sits well below the US Oil and Gas industry average of 2.1x and below a peer group average of 2.8x. On the other hand, the SWS fair P/S ratio model suggests a level closer to 1.0x for Genesis Energy, which implies the current 1.1x is slightly rich compared with where the multiple could settle if the market moved toward that fair ratio.
Explore the SWS fair ratio for Genesis Energy
Result: Price to sales ratio of 1.1x (ABOUT RIGHT)
However, Genesis Energy still faces risks from its current net loss, as well as any slowdown or disruption across its offshore pipelines or marine transportation operations.
Find out about the key risks to this Genesis Energy narrative.
Another view on Genesis Energy’s value
The P/S ratio presents Genesis Energy as roughly fairly priced, but the SWS DCF model points in a different direction. With the units at $14.82 and a future cash flow value estimate of $49.93, the model suggests the stock trades at a steep discount. Which signal should carry more weight for you?
Look into how the SWS DCF model arrives at its fair value.
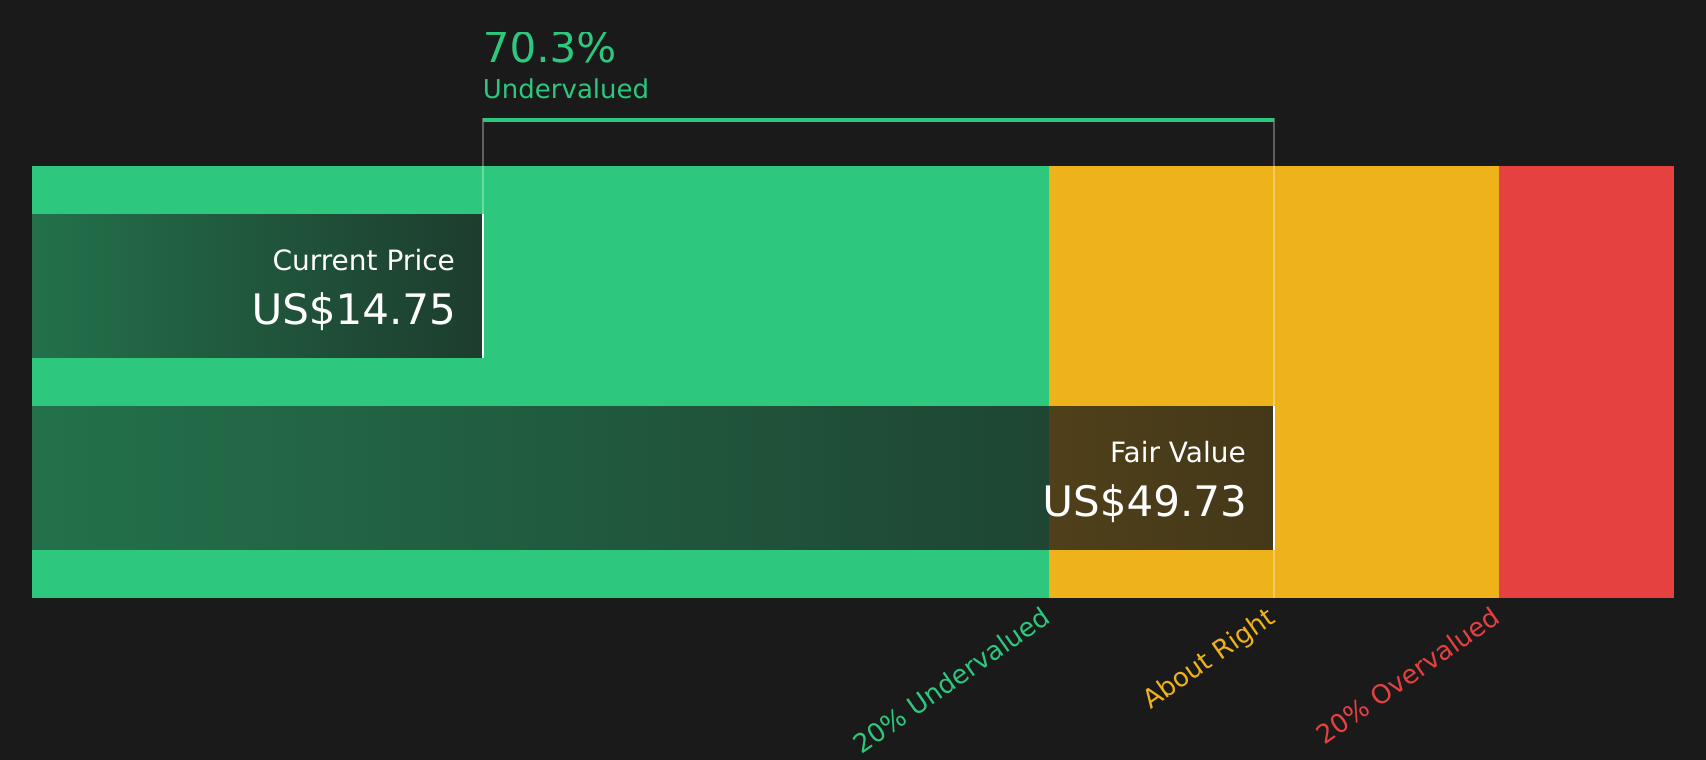
Simply Wall St performs a discounted cash flow (DCF) on every stock in the world every day (check out Genesis Energy for example). We show the entire calculation in full. You can track the result in your watchlist or portfolio and be alerted when this changes, or use our stock screener to discover 51 high quality undervalued stocks. If you save a screener we even alert you when new companies match - so you never miss a potential opportunity.
Next Steps
Does the mix of higher distributions, mixed recent returns and contrasting valuation signals leave you unsure about Genesis Energy right now? Take a closer look at the full picture and weigh both the upside potential and the areas of concern through the 3 key rewards and 1 important warning sign.
Looking for more investment ideas beyond Genesis Energy?
If Genesis Energy has sharpened your focus on valuation and income, do not stop here. Broadening your watchlist with other targeted ideas could enhance your next move.
- Target sturdier portfolios by scanning companies that score well on debt, cash and fundamentals through the solid balance sheet and fundamentals stocks screener (49 results).
- Explore potential value gaps by reviewing stocks that screen as quality yet are priced below their assessed worth using the 51 high quality undervalued stocks.
- Strengthen your income watchlist by checking companies that feature consistent, higher-yielding payouts in the 8 dividend fortresses.
This article by Simply Wall St is general in nature. We provide commentary based on historical data and analyst forecasts only using an unbiased methodology and our articles are not intended to be financial advice. It does not constitute a recommendation to buy or sell any stock, and does not take account of your objectives, or your financial situation. We aim to bring you long-term focused analysis driven by fundamental data. Note that our analysis may not factor in the latest price-sensitive company announcements or qualitative material. Simply Wall St has no position in any stocks mentioned.
Have feedback on this article? Concerned about the content? Get in touch with us directly. Alternatively, email editorial-team@simplywallst.com