


Okuma (TSE:6103) Plans Treasury Share Disposal, Is The Valuation Premium Justified?
Why Okuma’s latest board agenda matters for shareholders
Okuma (TSE:6103) has called a board meeting on 16 July 2026 to consider disposing of treasury shares for restricted share based remuneration, putting executive incentives and potential dilution in focus for investors.
See our latest analysis for Okuma.
Okuma’s share price has climbed to ¥5,020, with a 1 month share price return of 12.43% and a year to date share price return of 37.91%, while the 5 year total shareholder return of 114.85% points to solid longer term momentum.
If this board meeting has you thinking about where else capital might work hard in industrial technology, it could be worth scanning 34 robotics and automation stocks as a starting list of potential ideas.
Bulls see Okuma’s rising share price and incentive overhaul as signs of a stronger, better aligned business. Bears point to potential dilution and lofty expectations. Which side does the current valuation support next?
Preferred P/E of 23.5x for Okuma: Is it justified?
On the latest figures, Okuma trades on a P/E of 23.5x, which sits above both peers and the wider JP Machinery industry. That suggests investors are already pricing in stronger earnings power than average at the current share price of ¥5,020.
The P/E ratio compares a company’s share price with its earnings per share. For a manufacturer of machine tools like Okuma, it is a quick way to see how heavily the market prices current and expected profits. A higher P/E often reflects expectations for sturdier earnings growth, improved profitability, or a perception that earnings are less cyclical than the sector.
Here, the market is assigning Okuma a P/E multiple of 23.5x, while the peer group sits at 16.7x and the JP Machinery industry at 14.6x. That is a clear premium. At the same time, Simply Wall St’s fair P/E estimate for Okuma is 18.7x, which is lower than where the stock trades today. If sentiment cools, the market P/E could drift closer to that fair ratio level instead of holding such a wide gap over peers.
Explore the SWS fair ratio for Okuma
Result: Price-to-Earnings of 23.5x (OVERVALUED)
However, Okuma’s richer P/E and the board’s plan to use treasury shares for remuneration could both become pressure points if earnings or sentiment soften from this point.
Find out about the key risks to this Okuma narrative.
Another view on Okuma’s value
While Okuma looks expensive on a 23.5x P/E, our DCF model points the other way. On Simply Wall St estimates, the current share price of ¥5,020 sits about 10.5% below an implied value of ¥5,608. This frames the question. Is the P/E premium a warning, or is the DCF flagging opportunity?
Look into how the SWS DCF model arrives at its fair value.
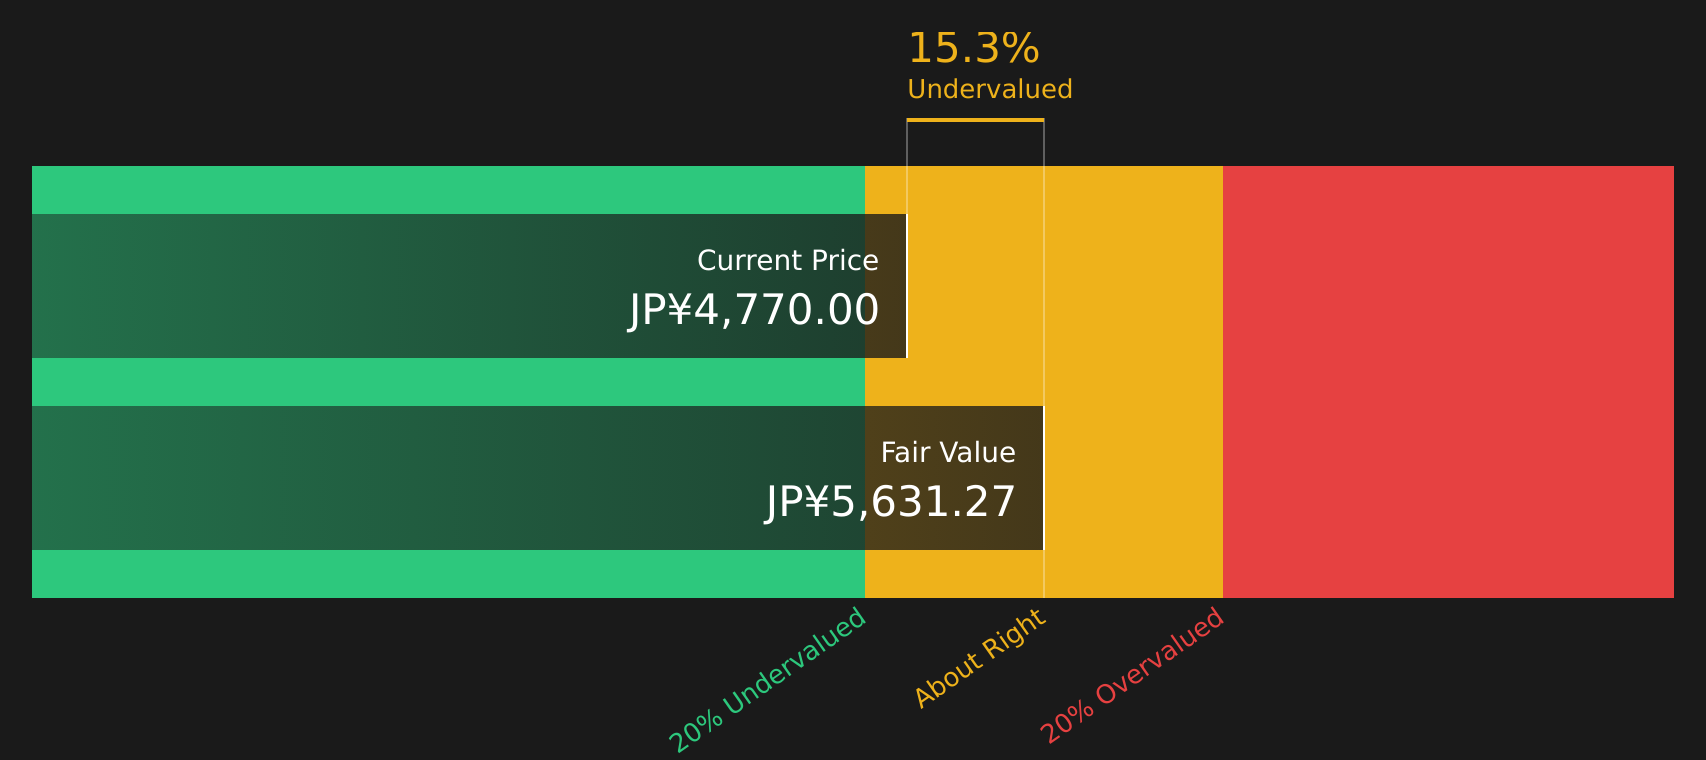
Simply Wall St performs a discounted cash flow (DCF) on every stock in the world every day (check out Okuma for example). We show the entire calculation in full. You can track the result in your watchlist or portfolio and be alerted when this changes, or use our stock screener to discover 19 high quality undervalued stocks. If you save a screener we even alert you when new companies match - so you never miss a potential opportunity.
Next Steps
Unsure whether Okuma’s current setup leans more towards risk or reward? Act while the details are fresh and weigh both sides against the 3 key rewards and 2 important warning signs.
Looking for more Okuma style investment ideas?
Do not stop with Okuma alone. Broaden your watchlist now and give yourself more options, or you might see others capitalise on ideas you never checked.
- Target potential mispricings by scanning 19 high quality undervalued stocks that combine quality fundamentals with attractive entry points.
- Strengthen your income focus by reviewing 41 dividend fortresses that aim to pair higher yields with resilience.
- Prioritise resilience first by checking 57 resilient stocks with low risk scores that score well on balance sheet strength and risk factors.
This article by Simply Wall St is general in nature. We provide commentary based on historical data and analyst forecasts only using an unbiased methodology and our articles are not intended to be financial advice. It does not constitute a recommendation to buy or sell any stock, and does not take account of your objectives, or your financial situation. We aim to bring you long-term focused analysis driven by fundamental data. Note that our analysis may not factor in the latest price-sensitive company announcements or qualitative material. Simply Wall St has no position in any stocks mentioned.
Have feedback on this article? Concerned about the content? Get in touch with us directly. Alternatively, email editorial-team@simplywallst.com