


Tronox (TROX) Stock Looks Overvalued Against Its Fair Value
Tronox Holdings has delivered a loss of 58.7% over the past 5 years, yet its current valuation picture is split, with the Discounted Cash Flow (DCF) intrinsic value estimate suggesting the stock trades at a premium while market based multiples screen it as undervalued. For investors trying to work out whether the recent share price around US$6.24 still offers value, the mixed signals put the focus squarely on which framework to trust.
- A loss of 58.7% over 5 years leaves long term holders under water and raises the bar for any new valuation case to be compelling.
- The key support for Tronox Holdings' valuation can come from the market viewing its current earnings and cash flow multiples as attractive, while the main risk is that cash generation falls short of what the DCF intrinsic value assumes, which would make the current price look stretched.
- On Simply Wall St's broader checks, Tronox Holdings scores 3 out of 6 for value, which points to a mixed picture rather than a clear bargain or clear overvaluation.
The issue now is whether Tronox Holdings' share price better reflects the cautious signal from the DCF intrinsic value estimate or the more positive read from its market multiples.
Has Tronox Holdings Run Too Far on Cash Flow?
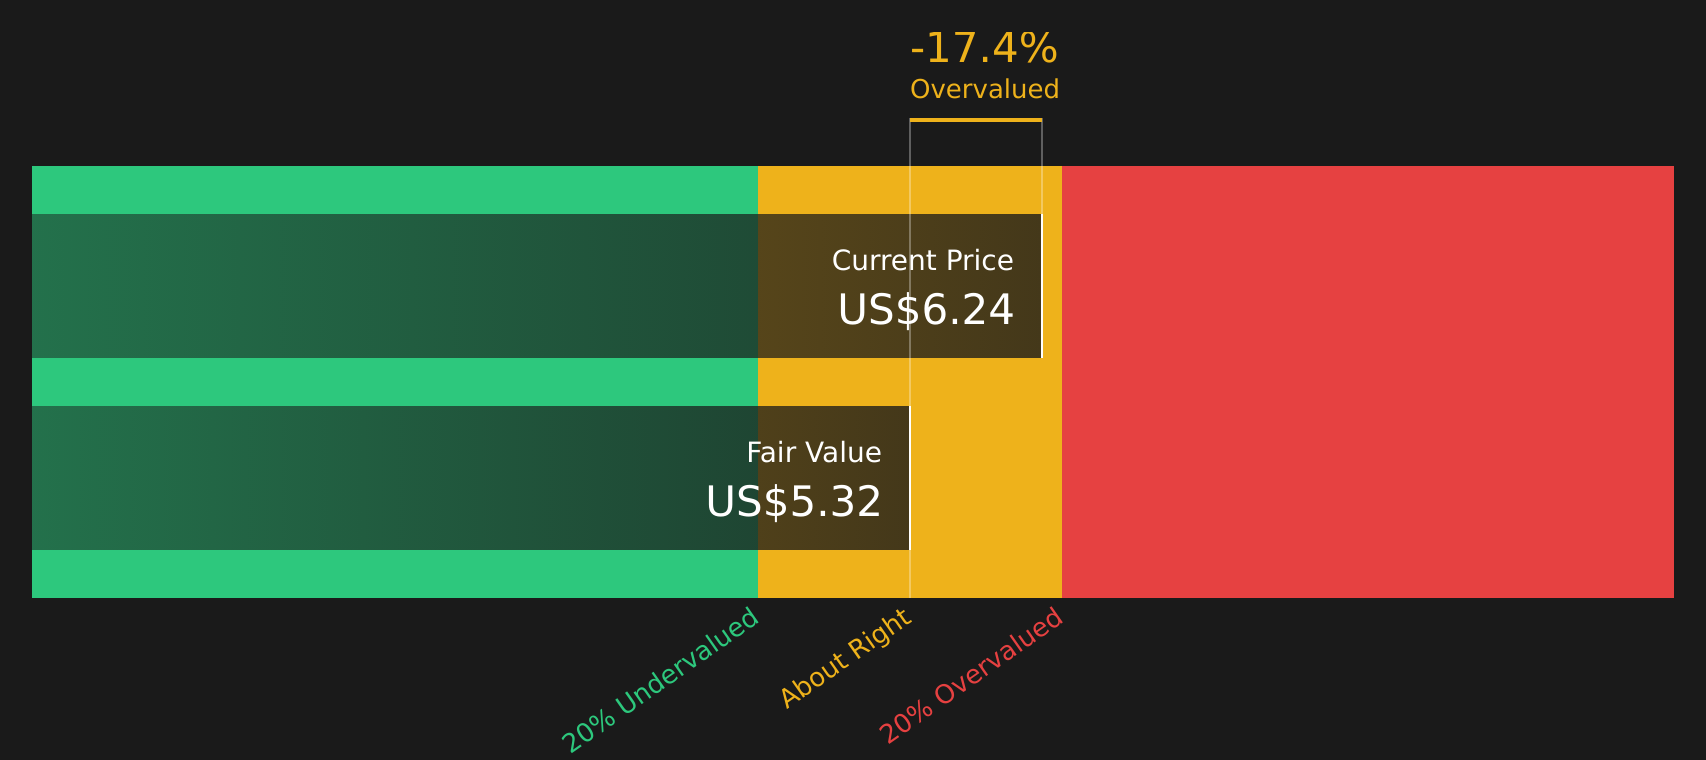
The Discounted Cash Flow (DCF) approach estimates what Tronox Holdings might be worth based on its expected future cash generation. For Tronox Holdings, the model starts from latest twelve month free cash flow of about $287.3 million in outflows, then assumes cash flows recover into positive territory over time rather than remain at this level.
On these projections, the 2 Stage Free Cash Flow to Equity model points to an intrinsic value of about $5.32 per share, compared with a recent share price around $6.24. That gap implies the stock trades at roughly a 17.4% premium to the DCF estimate, so the current price reflects higher implied future cash flows relative to the recent history.
On this DCF view, Tronox Holdings stock currently appears overvalued relative to its modeled cash flow value.
Our Discounted Cash Flow (DCF) analysis suggests Tronox Holdings may be overvalued by 17.4%. Discover 49 high quality undervalued stocks or create your own screener to find better value opportunities.
Is Tronox Holdings Still Cheap on Sales?
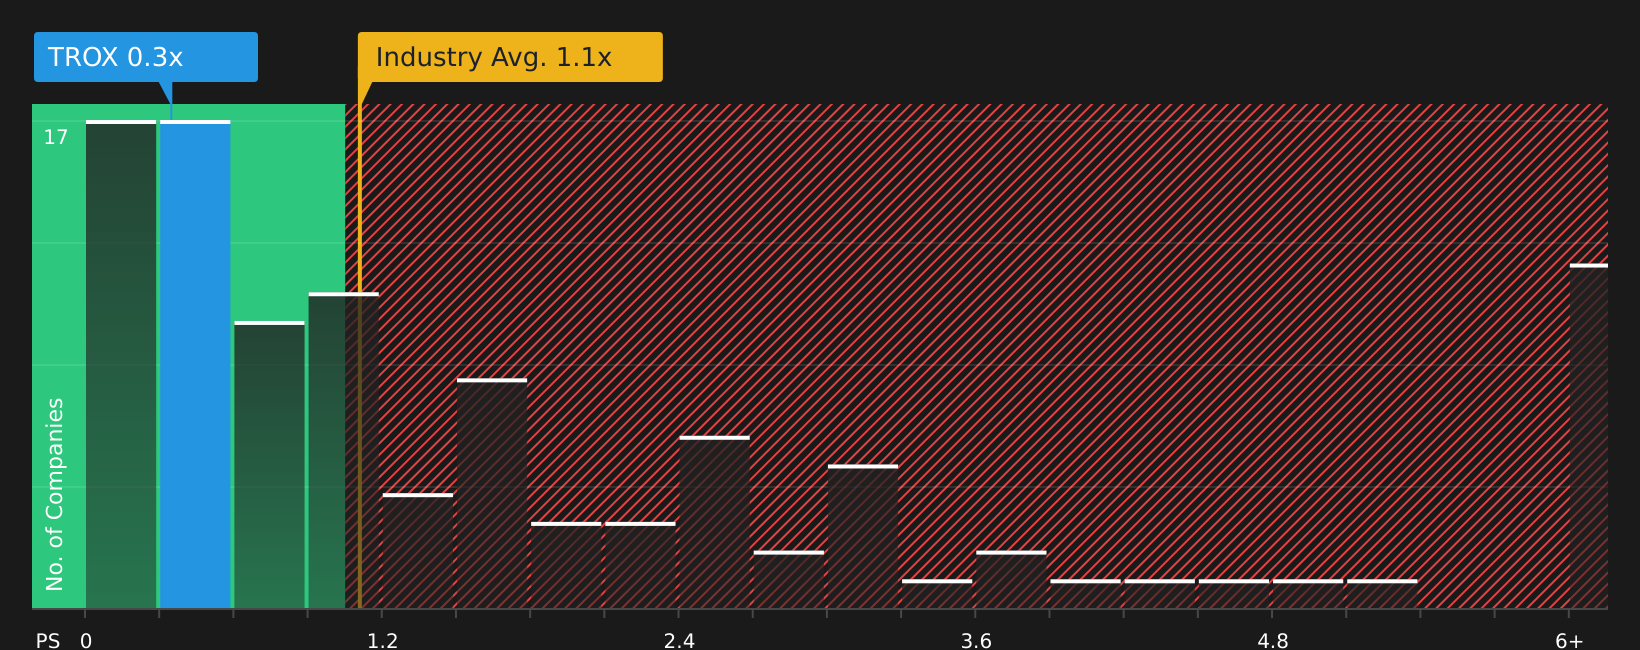
For Tronox Holdings, the P/S ratio fits well because revenue can be a cleaner anchor than earnings when profits are volatile or negative. The stock trades on a P/S of about 0.3x, compared with a Chemicals industry average of 1.1x and a peer group average of 0.5x. This means the market is currently paying much less per dollar of Tronox Holdings' sales than for many competitors.
The tailored fair P/S ratio for Tronox Holdings is estimated at around 0.9x, which is several turns above the current 0.3x level. That gap suggests the stock screens as undervalued on this sales based metric, even after accounting for the company specific risk profile captured in the fair ratio model.
On the P/S multiple, Tronox Holdings stock appears undervalued relative to both its own fair ratio and sector benchmarks.
See what the numbers say about this price — find out in our valuation breakdown.
The Tronox Holdings Narrative: What Would Justify Today's Price?
Simply Wall St Narratives for Tronox Holdings are designed to turn this valuation puzzle into concrete scenarios about what has to happen to future growth, margins and earnings for the stock to be worth materially more, or less, than today. These narratives sit on the company's Community page. Each narrative links a fair value to a particular mix of potential catalysts and risks so you can track which story about Tronox Holdings' future is actually unfolding over time.
The community is split on Tronox Holdings, with one camp seeing upside from cost savings and new projects while the other is focused on debt and TiO2 demand risk.
Bull case: 11% undervalued
"The company's ongoing cost improvement program and operational efficiency initiatives including vertical integration and strategic mining investments are anticipated to deliver $125 million to $175 million in sustainable annual savings by the end of 2026..."
Read the full Bull Case to see why Tronox Holdings could be undervalued
Bear case: 56% overvalued
"Heightened competition from lower cost producers, especially in China, along with persistent industry overcapacity and recent price erosion in major regions such as Europe, are expected to undermine both pricing power and volume growth..."
Read the full Bear Case to see why Tronox Holdings could be overvalued
Do you think there's more to the story for Tronox Holdings? Head over to our Community to see what others are saying!
The Bottom Line
For Tronox Holdings, the Discounted Cash Flow (DCF) intrinsic value estimate points to shares trading above modeled cash flows, while the sales based multiples still make the stock look undervalued against peers and its tailored fair P/S ratio. That split reflects a core tension between cash flow timing and capital intensity on one side and market expectations and relative pricing on the other. With broader checks sitting in the middle, the key question from here is whether Tronox Holdings can translate its revenue base into steadier, stronger free cash generation or whether the current discount on sales is simply compensation for that execution and industry risk.
This article by Simply Wall St is general in nature. We provide commentary based on historical data and analyst forecasts only using an unbiased methodology and our articles are not intended to be financial advice. It does not constitute a recommendation to buy or sell any stock, and does not take account of your objectives, or your financial situation. We aim to bring you long-term focused analysis driven by fundamental data. Note that our analysis may not factor in the latest price-sensitive company announcements or qualitative material. Simply Wall St has no position in any stocks mentioned.
Have feedback on this article? Concerned about the content? Get in touch with us directly. Alternatively, email editorial-team@simplywallst.com