


OBIC Business Consultants (TSE:4733) After Strong Quarterly Results Looks Fully Valued
Why OBIC Business Consultants' Latest Earnings Matter
OBIC Business Consultants (TSE:4733) reported first quarter results to June 30, 2026, with sales of ¥13,831.75 million, net income of ¥4,877.85 million, and basic EPS of ¥64.89 from continuing operations.
See our latest analysis for OBIC Business Consultants.
The latest earnings release appears to have shifted sentiment around OBIC Business Consultants. The share price is at ¥7,638, with a 1 month share price return of 31.87%. However, the year to date share price return is still down 8.97% and the 1 year total shareholder return is down 11.74%, compared with a 3 year total shareholder return of 36.67% and a 5 year total shareholder return of 45.94%. This suggests that recent momentum has picked up after a weaker spell.
If OBIC Business Consultants' recent move has you rethinking your watchlist, this can be a good moment to look beyond a single software stock and scan for other opportunities through the 10 top founder-led companies
After OBIC Business Consultants' sharp 1 month rebound and solid quarterly figures, the share price now sits closer to analyst targets than before. Does the current balance of risk and reward still lean in buyers' favour?
Preferred P/E of 30.3x: Is it justified?
On traditional valuation measures, OBIC Business Consultants is being priced at a premium, with a P/E of 30.3x at a share price of ¥7,638, compared with both peers and the wider JP Software industry.
The P/E ratio links the current share price to earnings per share, so a higher P/E usually reflects higher expectations for future earnings. For a software company like OBIC Business Consultants, investors often focus on how consistently earnings and revenue are growing, and whether margins and returns can support that premium over time.
Here, the signals are mixed. On one hand, earnings have grown around 12.2% per year over the past 5 years and growth over the last year has been quicker than that 5 year pace, with revenue also forecast to grow faster than the broader JP market. On the other hand, the current P/E of 30.3x is above the estimated fair P/E of 20.6x, while the SWS DCF model value of about ¥7,398 per share sits slightly below the current price and earnings growth is expected to be below 20% and close to the broader market. That combination points to a valuation that already bakes in a fair amount of optimism rather than leaving clear room for a re rating.
Against the sector backdrop, the contrast is clear. The 30.3x P/E for OBIC Business Consultants is materially higher than the JP Software industry average of 17.1x, even though its earnings growth over the past year has not exceeded the wider software sector and future profit growth is not flagged as high. With the fair P/E estimate sitting well below the current multiple, there is a distinct gap between what the market is currently paying and the level the ratio could move toward if expectations cool.
Explore the SWS fair ratio for OBIC Business Consultants
Result: Price-to-Earnings of 30.3x (OVERVALUED)
However, OBIC Business Consultants' premium P/E and recent share price rebound could prove fragile if revenue growth slows or if analyst expectations shift lower.
Find out about the key risks to this OBIC Business Consultants narrative.
Another View: What the SWS DCF Model Says
While the P/E of 30.3x makes OBIC Business Consultants look expensive versus the JP Software industry and its own fair ratio of 20.6x, the SWS DCF model paints a slightly different picture. On this view, the shares at ¥7,638 sit only modestly above an estimated value of about ¥7,398 per share, which suggests far less of a gap to close. If earnings and cash flows track forecasts, is this pricing tight enough to limit upside, or just close enough to keep longer term holders comfortable?
Look into how the SWS DCF model arrives at its fair value.
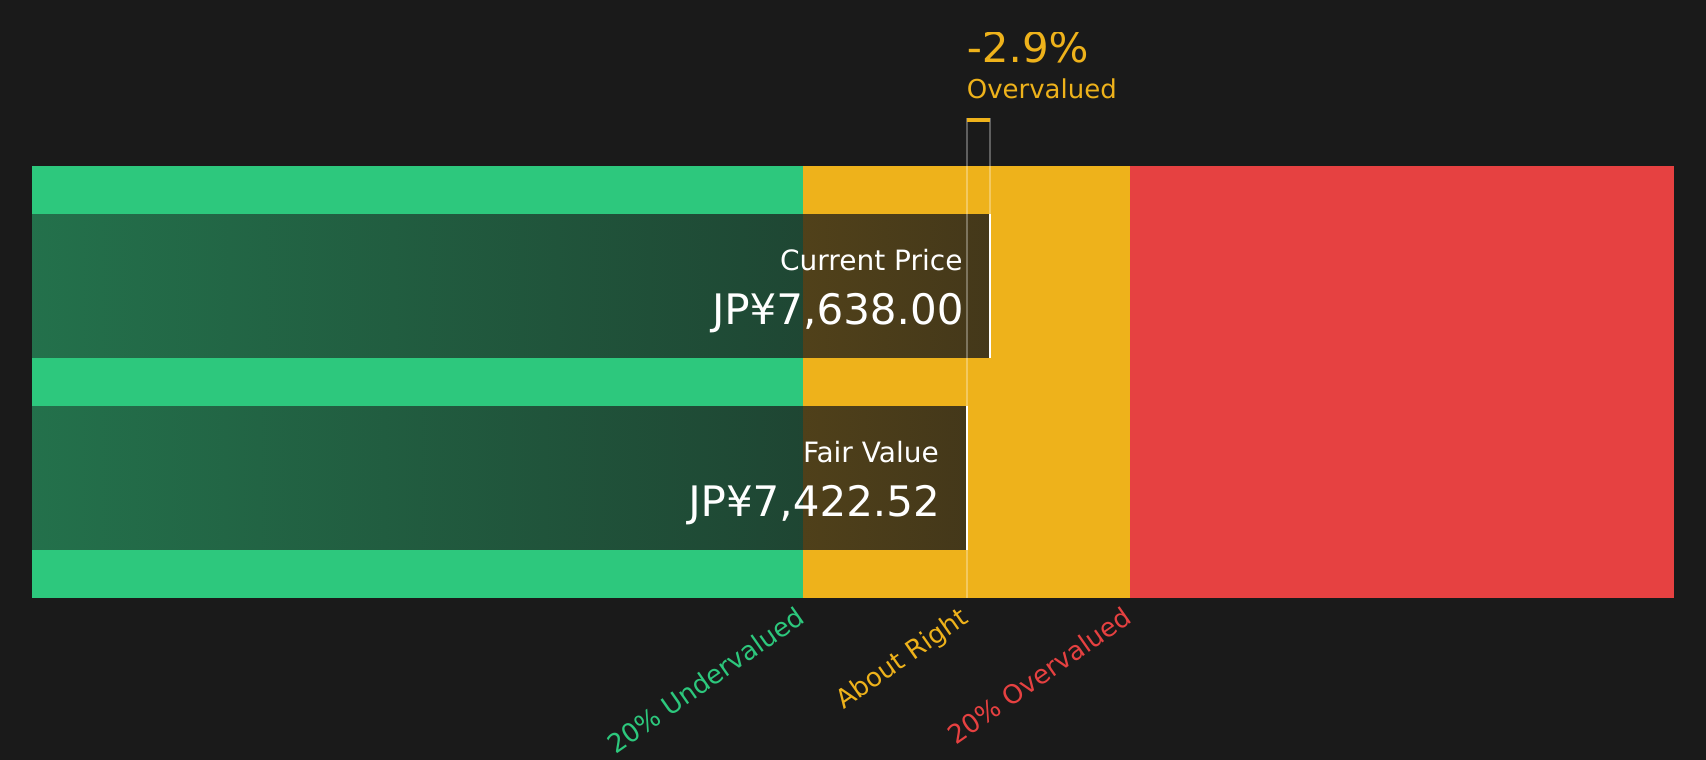
Simply Wall St performs a discounted cash flow (DCF) on every stock in the world every day (check out OBIC Business Consultants for example). We show the entire calculation in full. You can track the result in your watchlist or portfolio and be alerted when this changes, or use our stock screener to discover 17 high quality undervalued stocks. If you save a screener we even alert you when new companies match - so you never miss a potential opportunity.
Next Steps
With sentiment around OBIC Business Consultants looking finely balanced, this is a good time to inspect the numbers yourself and decide what stands out most. To see why some investors are still optimistic, review the 2 key rewards
Looking for more investment ideas beyond OBIC Business Consultants?
OBIC Business Consultants may already be on your radar, but broadening your watchlist today can help you spot opportunities that others only notice much later.
- Target resilience by checking out companies that appear built to weather tougher conditions in the 52 resilient stocks with low risk scores
- Hunt for quality at a reasonable price by using the 17 high quality undervalued stocks to surface stocks that pair stronger fundamentals with potentially attractive pricing.
- Spot potential hidden opportunities before they are widely followed by reviewing the screener containing 62 high quality undiscovered gems
This article by Simply Wall St is general in nature. We provide commentary based on historical data and analyst forecasts only using an unbiased methodology and our articles are not intended to be financial advice. It does not constitute a recommendation to buy or sell any stock, and does not take account of your objectives, or your financial situation. We aim to bring you long-term focused analysis driven by fundamental data. Note that our analysis may not factor in the latest price-sensitive company announcements or qualitative material. Simply Wall St has no position in any stocks mentioned.
Have feedback on this article? Concerned about the content? Get in touch with us directly. Alternatively, email editorial-team@simplywallst.com