


Asian Stocks Trading At An Estimated Discount Of 40.9% To 44.1%
In recent weeks, Asian markets have experienced volatility, with technology stocks facing pressure and geopolitical tensions affecting investor sentiment. Amid these fluctuations, identifying undervalued stocks becomes crucial for investors seeking opportunities in a complex economic landscape.
Top 10 Undervalued Stocks Based On Cash Flows In Asia
| Name | Current Price | Fair Value (Est) | Discount (Est) |
| Techwing (KOSDAQ:A089030) | ₩46200.00 | ₩91323.51 | 49.4% |
| SHIFT (TSE:3697) | ¥766.50 | ¥1490.88 | 48.6% |
| Samyang Foods (KOSE:A003230) | ₩1109000.00 | ₩2214803.55 | 49.9% |
| Pan-United (SGX:P52) | SGD1.59 | SGD3.16 | 49.7% |
| OVERLAP HoldingsInc (TSE:414A) | ¥855.00 | ¥1664.58 | 48.6% |
| Moshi Moshi Retail Corporation (SET:MOSHI) | THB38.75 | THB76.04 | 49% |
| Info-Tech Systems (SGX:ITS) | SGD0.98 | SGD1.94 | 49.4% |
| Horizon Robotics (SEHK:9660) | HK$4.75 | HK$9.36 | 49.2% |
| Hana Technology (KOSDAQ:A299030) | ₩11750.00 | ₩23288.61 | 49.5% |
| Anhui Tongguan Copper Foil Group (SZSE:301217) | CN¥95.36 | CN¥187.20 | 49.1% |
Let's dive into some prime choices out of the screener.
San Miguel Food and Beverage (PSE:FB)
Overview: San Miguel Food and Beverage, Inc. is a company involved in the manufacturing and marketing of processed meat products in the Philippines, with a market capitalization of approximately ₱286.60 billion.
Operations: The company's revenue is primarily derived from its Food segment at ₱199.59 billion, followed by Beer and Non-Alcoholic Beverage at ₱155.18 billion, and Spirits at ₱67.43 billion.
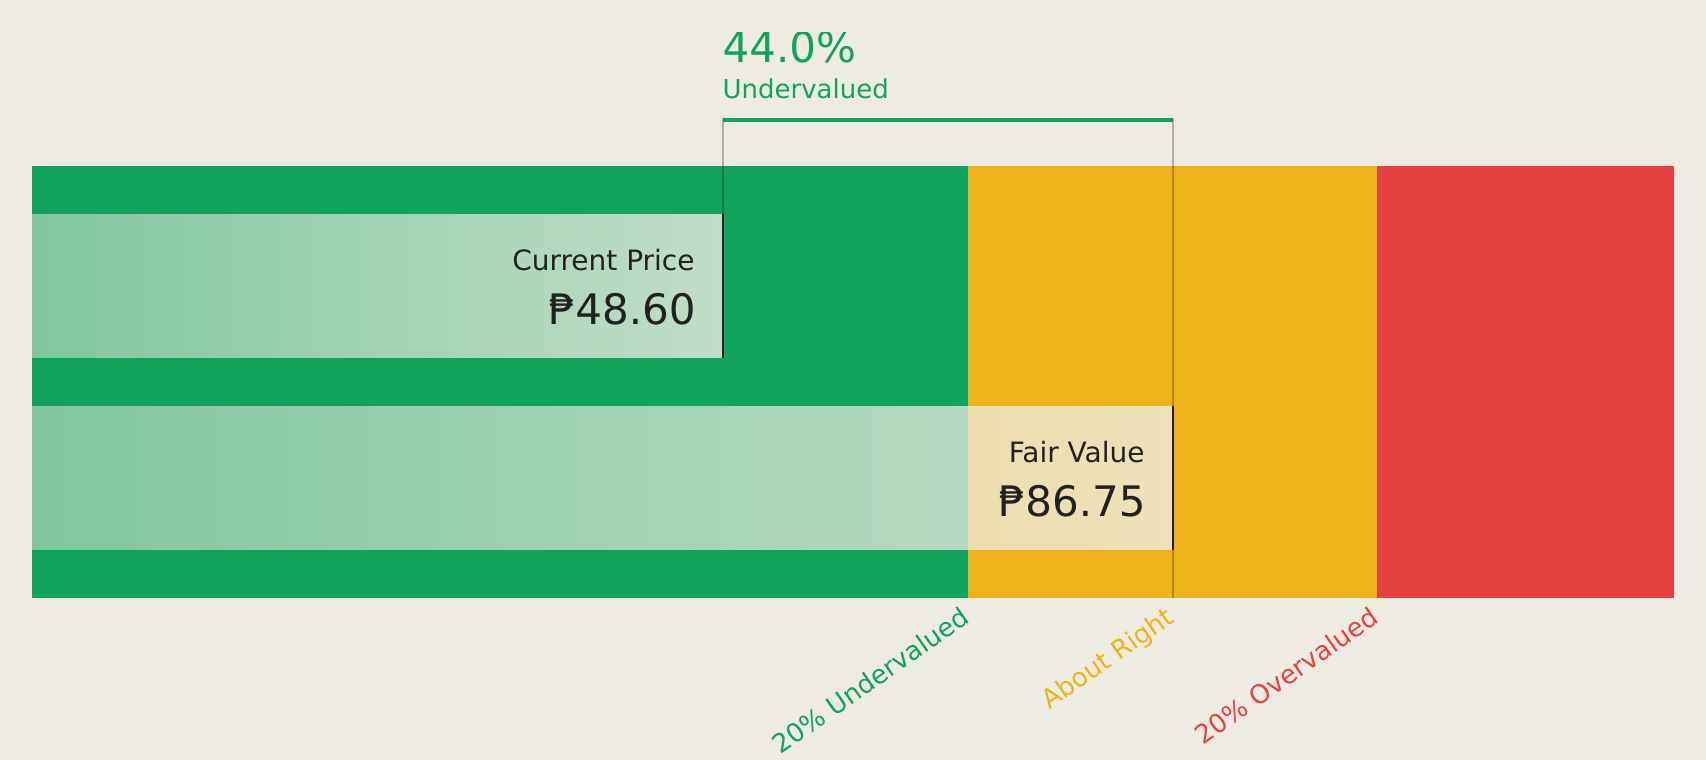
Estimated Discount To Fair Value: 44.1%
San Miguel Food and Beverage is trading at a significant discount, over 20% below its future cash flow value of ₱86.75 per share. Its earnings grew by 11.8% last year and are expected to increase by 11.2% annually, outpacing the Philippine market's growth forecast of 9.4%. Despite an unstable dividend history, the company remains a good relative value compared to peers, with strong profit growth prospects and robust return on equity projections at 22.6%.
- In light of our recent growth report, it seems possible that San Miguel Food and Beverage's financial performance will exceed current levels.
- Click here to discover the nuances of San Miguel Food and Beverage with our detailed financial health report.
Sigenergy Technology (SEHK:6656)
Overview: Sigenergy Technology Co., Ltd specializes in developing and manufacturing energy storage systems, inverters, and smart energy solutions for residential, commercial, and industrial applications, with a market cap of approximately HK$73.26 billion.
Operations: The company generates revenue primarily from its Batteries / Battery Systems segment, amounting to approximately CN¥9 billion.
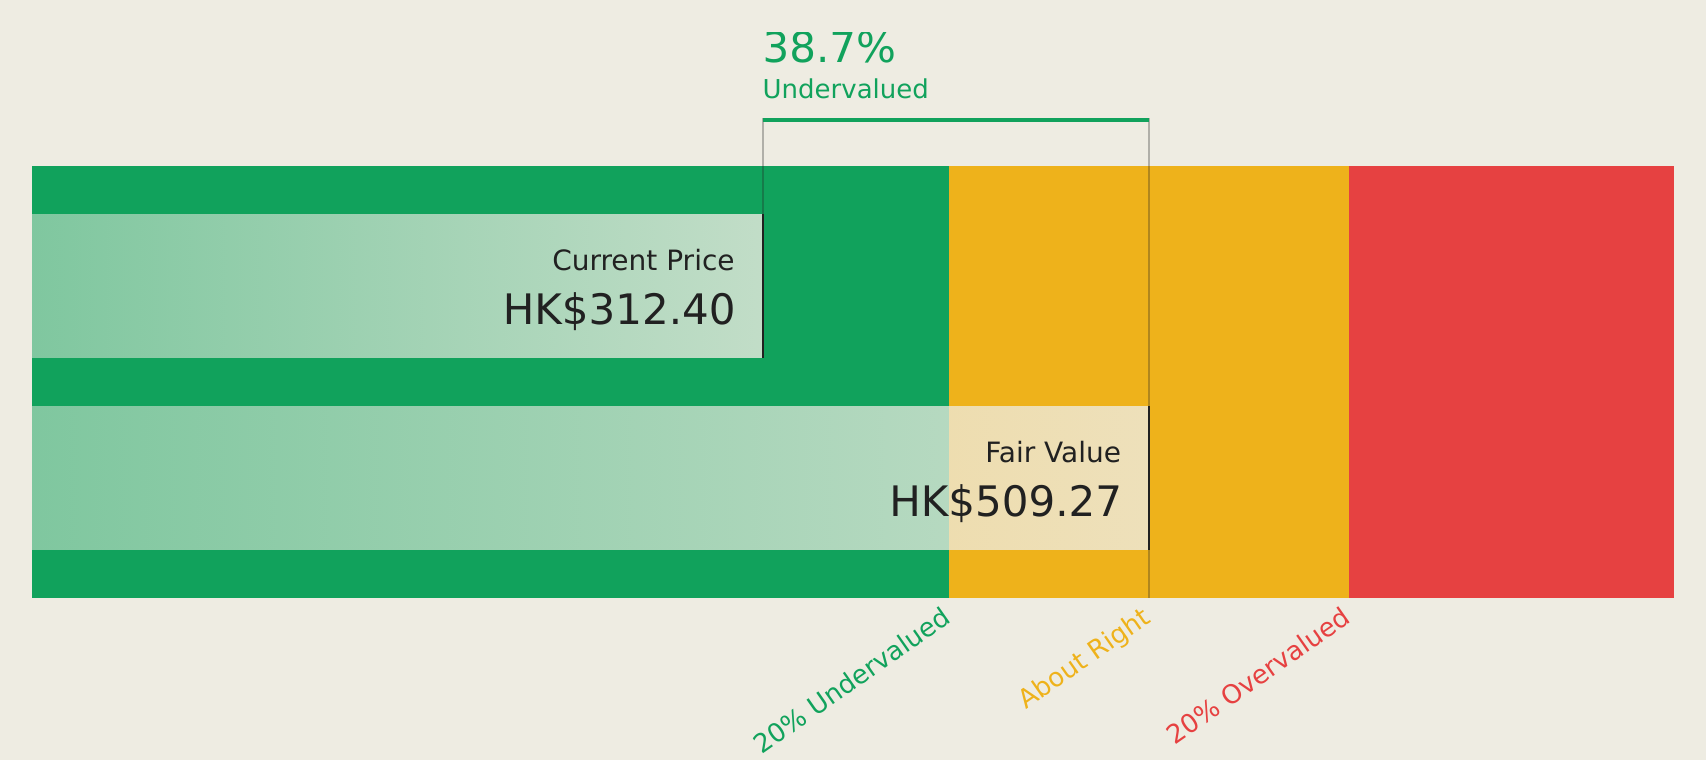
Estimated Discount To Fair Value: 42.3%
Sigenergy Technology is trading at HK$294.4, significantly below its estimated future cash flow value of HK$510.17, marking it as undervalued by over 20%. The company's earnings grew dramatically last year and are forecast to continue growing at 32.7% annually, surpassing the Hong Kong market average. Recent product launches like the SigenMate 2700 Ultra highlight Sigenergy's innovative capabilities in AI-driven energy solutions, supporting its robust growth trajectory and high return on equity projections of 34.1%.
- The analysis detailed in our Sigenergy Technology growth report hints at robust future financial performance.
- Dive into the specifics of Sigenergy Technology here with our thorough financial health report.
Elite Material (TWSE:2383)
Overview: Elite Material Co., Ltd. manufactures and sells copper clad laminates, electronic-industrial specialty chemicals, raw materials, and electronic components in Taiwan, China, and internationally with a market cap of NT$1.84 trillion.
Operations: The company's revenue is derived from its Domestic Segment, which accounts for NT$19.84 billion, and its Foreign Departments, contributing NT$109.44 billion.
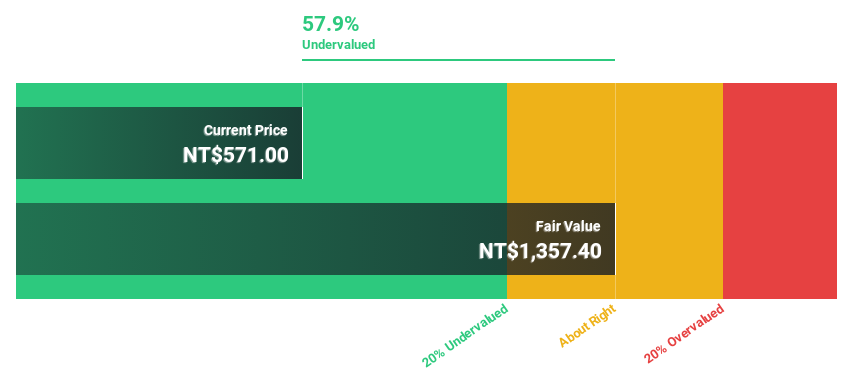
Estimated Discount To Fair Value: 40.9%
Elite Material is trading at NT$5,125, well below its estimated future cash flow value of NT$8,667.33. Earnings grew 49.2% last year and are expected to grow significantly over the next three years, outpacing the Taiwan market average. Recent earnings reports show sales increased to NT$33.07 billion from NT$21.68 billion year-over-year, with net income rising to NT$5.34 billion from NT$3.47 billion, demonstrating strong financial performance despite share price volatility.
- The growth report we've compiled suggests that Elite Material's future prospects could be on the up.
- Click to explore a detailed breakdown of our findings in Elite Material's balance sheet health report.
Where To Now?
- Discover the full array of 215 Undervalued Asian Stocks Based On Cash Flows right here.
- Have you diversified into these companies? Leverage the power of Simply Wall St's portfolio to keep a close eye on market movements affecting your investments.
- Enhance your investing ability with the Simply Wall St app and enjoy free access to essential market intelligence spanning every continent.
Curious About Other Options?
- Explore high-performing small cap companies that haven't yet garnered significant analyst attention.
- Diversify your portfolio with solid dividend payers offering reliable income streams to weather potential market turbulence.
- Fuel your portfolio with companies showing strong growth potential, backed by optimistic outlooks both from analysts and management.
This article by Simply Wall St is general in nature. We provide commentary based on historical data and analyst forecasts only using an unbiased methodology and our articles are not intended to be financial advice. It does not constitute a recommendation to buy or sell any stock, and does not take account of your objectives, or your financial situation. We aim to bring you long-term focused analysis driven by fundamental data. Note that our analysis may not factor in the latest price-sensitive company announcements or qualitative material. Simply Wall St has no position in any stocks mentioned.
Have feedback on this article? Concerned about the content? Get in touch with us directly. Alternatively, email editorial-team@simplywallst.com