


European Market Highlights 3 Stocks That May Be Trading At A Discount
The European market has recently experienced volatility, with the pan-European STOXX Europe 600 Index ending a week of fluctuations broadly unchanged. Amidst this backdrop, investors are keenly analyzing corporate earnings and geopolitical tensions to identify opportunities. In such an environment, stocks that may be trading at a discount often attract attention due to their potential for value appreciation when market conditions stabilize.
Top 10 Undervalued Stocks Based On Cash Flows In Europe
| Name | Current Price | Fair Value (Est) | Discount (Est) |
| PCC Rokita (WSE:PCR) | PLN71.80 | PLN142.17 | 49.5% |
| Netcompany Group (CPSE:NETC) | DKK304.40 | DKK605.89 | 49.8% |
| Micro Systemation (OM:MSAB B) | SEK86.20 | SEK172.07 | 49.9% |
| Laboratorios Farmaceuticos Rovi (BME:ROVI) | €54.70 | €109.13 | 49.9% |
| Hiab Oyj (HLSE:HIAB) | €53.25 | €106.46 | 50% |
| F-Secure Oyj (HLSE:FSECURE) | €1.90 | €3.80 | 50% |
| Deutsche Beteiligungs (XTRA:DBAN) | €21.90 | €43.48 | 49.6% |
| Com.Tel (BIT:CMTL) | €1.86 | €3.70 | 49.7% |
| Casta Diva Group (BIT:CDG) | €3.06 | €6.06 | 49.5% |
| Cambi (OB:CAMBI) | NOK21.50 | NOK42.59 | 49.5% |
We're going to check out a few of the best picks from our screener tool.
Alimak Group (OM:ALIG)
Overview: Alimak Group AB (publ) is a company that designs, manufactures, sells, and services vertical access and working at height solutions globally, with a market cap of SEK12.91 billion.
Operations: The company's revenue is derived from several segments: Wind (SEK709 million), HS & PS (SEK1.28 billion), Industrial (SEK1.58 billion), Construction (SEK1.39 billion), and Facade Access (SEK1.85 billion).
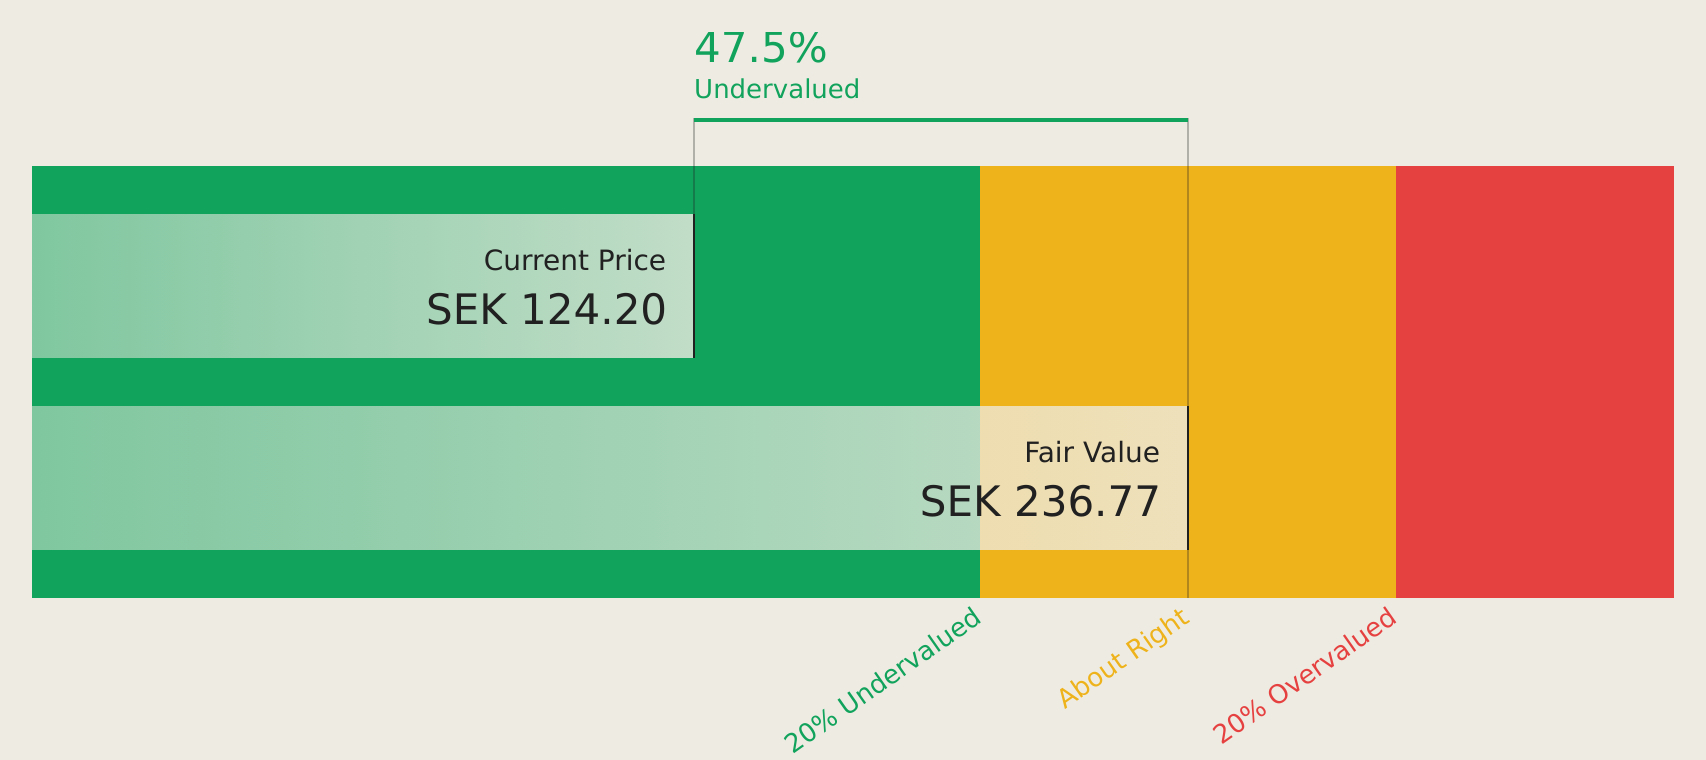
Estimated Discount To Fair Value: 42.5%
Alimak Group appears undervalued based on cash flows, trading at SEK122 against an estimated future cash flow value of SEK212.08. Despite a decline in recent earnings and revenue, its annual profit growth is forecast to significantly outpace the Swedish market. Although revenue growth is slower than the ideal rate, it surpasses the negative trend in Sweden's market. The company is actively pursuing acquisitions to bolster organic growth amid a stable yet leveraged capital allocation strategy.
- Upon reviewing our latest growth report, Alimak Group's projected financial performance appears quite optimistic.
- Unlock comprehensive insights into our analysis of Alimak Group stock in this financial health report.
Momentum Group (OM:MMGR B)
Overview: Momentum Group AB (publ) supplies industrial components and services to the industrial sector across Sweden, Norway, Denmark, Finland, and internationally with a market capitalization of approximately SEK7.23 billion.
Operations: The company's revenue segments comprise Industry at SEK1.73 billion and Infrastructure at SEK1.47 billion, serving the industrial sector across various regions.
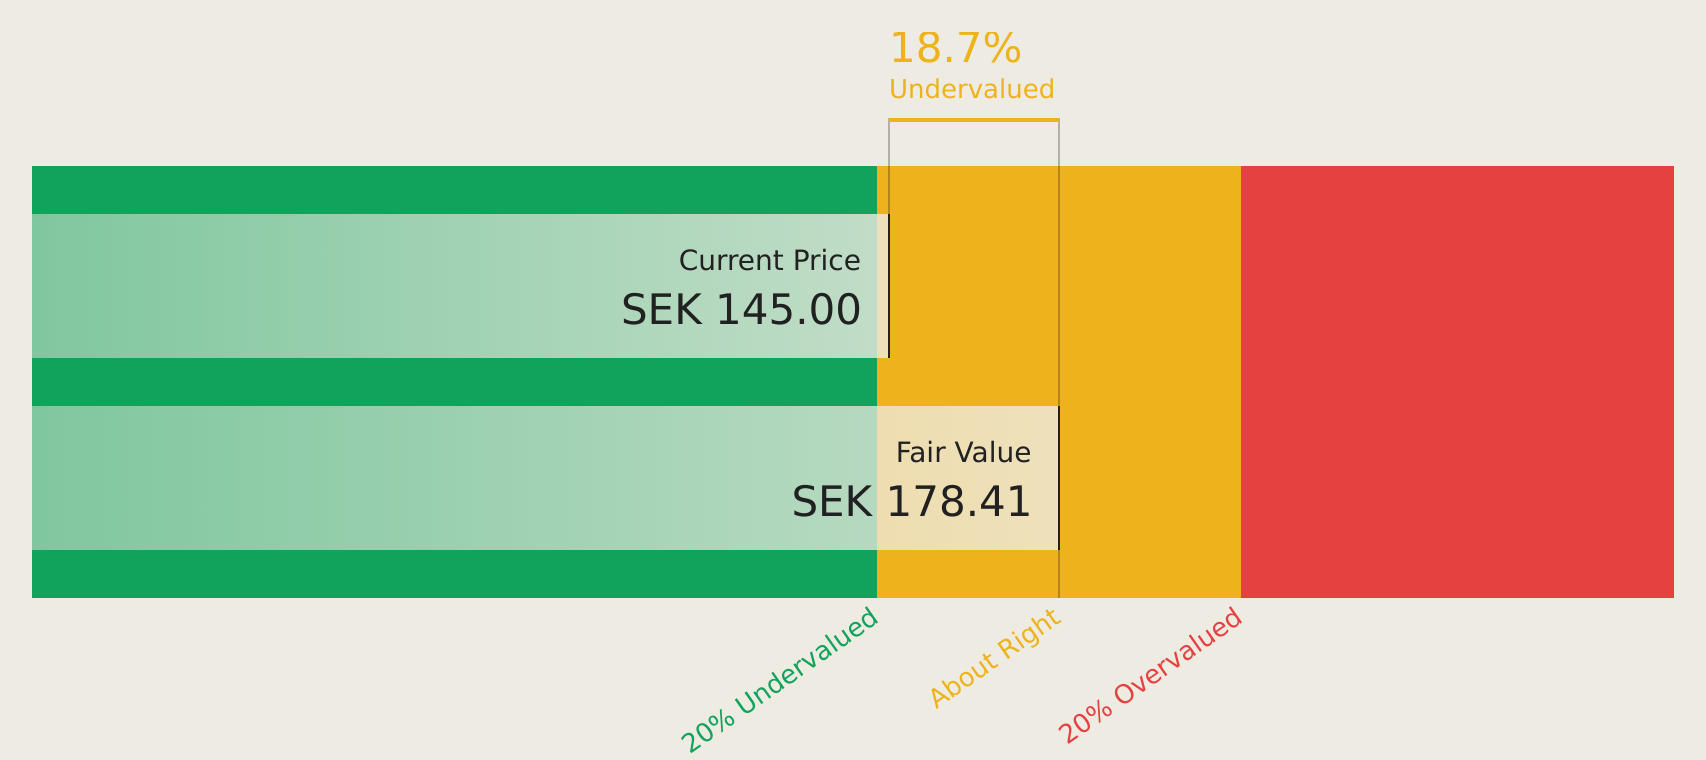
Estimated Discount To Fair Value: 18.2%
Momentum Group is trading at SEK146.2, beneath its estimated future cash flow value of SEK178.69, reflecting some undervaluation. Its earnings are projected to grow annually by 13.25%, surpassing the Swedish market's rate, though revenue growth remains moderate at 8.2%. Recent reports show improved net income and earnings per share for Q2 2026 compared to the previous year, indicating steady financial performance despite a high debt level and completed share buyback program.
- The analysis detailed in our Momentum Group growth report hints at robust future financial performance.
- Click here to discover the nuances of Momentum Group with our detailed financial health report.
Galderma Group (SWX:GALD)
Overview: Galderma Group AG is a global dermatology company with a market cap of CHF41.05 billion.
Operations: The company generates revenue from its dermatology segment, amounting to $5.24 billion.
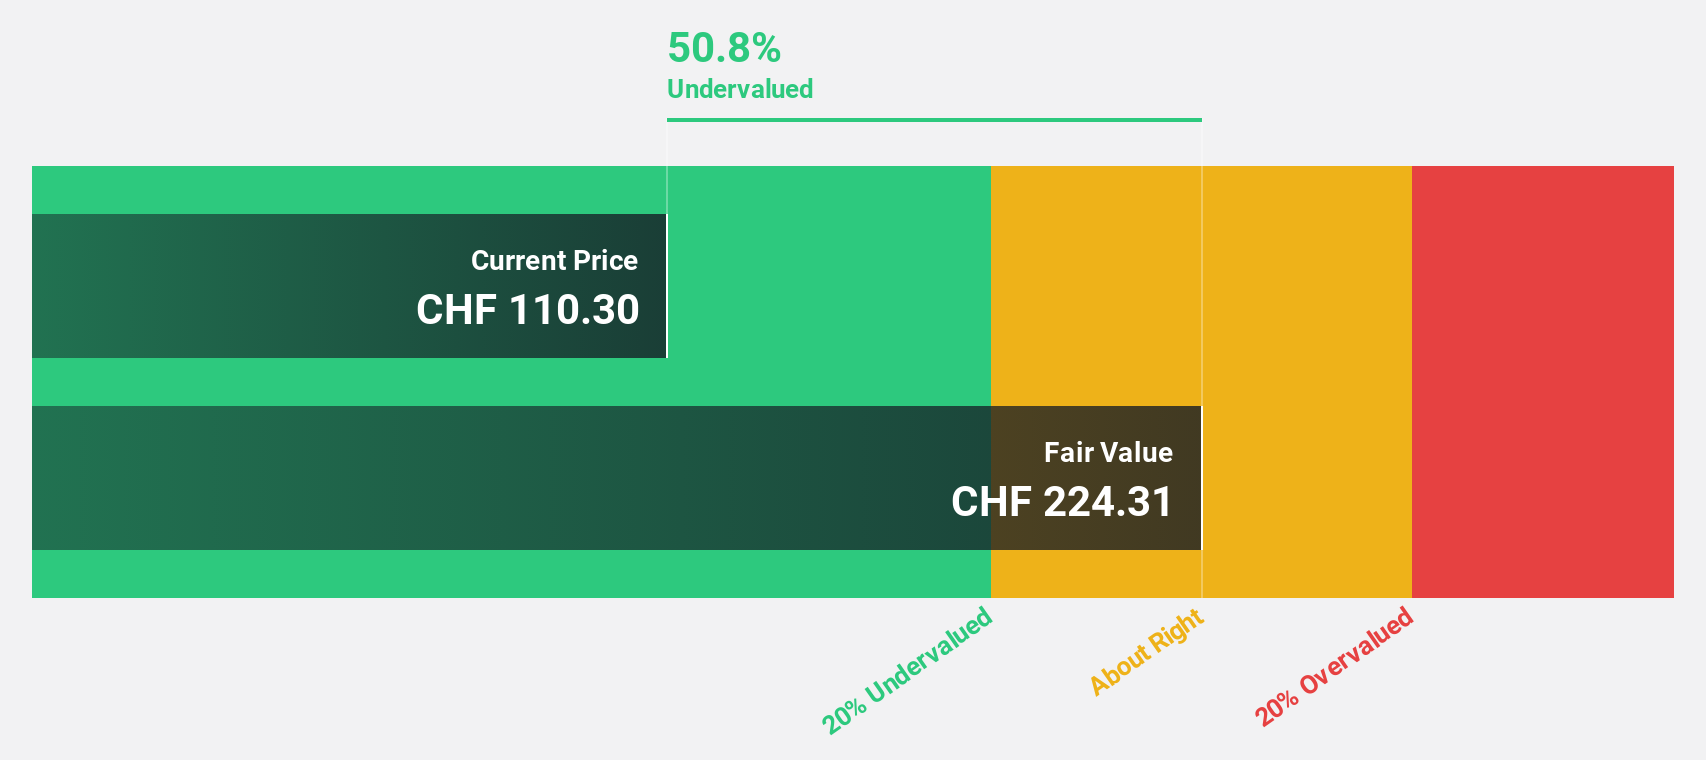
Estimated Discount To Fair Value: 41.3%
Galderma Group, trading at CHF175, is undervalued based on cash flows with a fair value estimate of CHF298.16. Its earnings are forecasted to grow significantly at 23.93% annually, outpacing the Swiss market's 11.1%. Despite receiving a Complete Response Letter from the FDA for RelabotulinumtoxinA, Galderma is addressing manufacturing observations and continues international expansion with Relfydess approved in 33 markets, supporting its strong cash flow potential amidst regulatory challenges.
- In light of our recent growth report, it seems possible that Galderma Group's financial performance will exceed current levels.
- Click here and access our complete balance sheet health report to understand the dynamics of Galderma Group.
Make It Happen
- Explore the 208 names from our Undervalued European Stocks Based On Cash Flows screener here.
- Invested in any of these stocks? Simplify your portfolio management with Simply Wall St and stay ahead with our alerts for any critical updates on your stocks.
- Join a community of smart investors by using Simply Wall St. It's free and delivers expert-level analysis on worldwide markets.
Interested In Other Possibilities?
- Explore high-performing small cap companies that haven't yet garnered significant analyst attention.
- Diversify your portfolio with solid dividend payers offering reliable income streams to weather potential market turbulence.
- Fuel your portfolio with companies showing strong growth potential, backed by optimistic outlooks both from analysts and management.
This article by Simply Wall St is general in nature. We provide commentary based on historical data and analyst forecasts only using an unbiased methodology and our articles are not intended to be financial advice. It does not constitute a recommendation to buy or sell any stock, and does not take account of your objectives, or your financial situation. We aim to bring you long-term focused analysis driven by fundamental data. Note that our analysis may not factor in the latest price-sensitive company announcements or qualitative material. Simply Wall St has no position in any stocks mentioned.
Have feedback on this article? Concerned about the content? Get in touch with us directly. Alternatively, email editorial-team@simplywallst.com