


Is Imperial Oil (TSX:IMO) Fully Valued As Pipeline Momentum Builds?
Imperial Oil (TSX:IMO) is back in focus after Canada, Alberta, and major oil sands producers advanced the West Coast Oil Pipeline project, which is tied to emissions reduction commitments and the Pathways carbon capture initiative.
See our latest analysis for Imperial Oil.
The recent agreement on the West Coast Oil Pipeline comes as Imperial Oil’s share price has been broadly steady in the short term, with the 7 day share price return down 1.6% but the year to date share price return up 38.2%, and the 5 year total shareholder return at a very large multiple of the starting value. This signals that long running momentum remains in place even as investors weigh upcoming earnings and the new infrastructure outlook.
If the pipeline story has you thinking about energy infrastructure more broadly, this could be a useful moment to scan 34 power grid technology and infrastructure stocks
After such a strong multi year run and a 38.2% gain so far this year, the key tension for Imperial Oil is whether the recent pause following the pipeline news leaves meaningful upside ahead or signals that most of the gains are already behind it.
Most Popular Narrative: 10% Overvalued
On the latest numbers, Imperial Oil trades at CA$169.02 against a most followed fair value estimate of CA$153.19, so the narrative points to a premium that hinges on specific long term execution and cash return assumptions.
Digitalization and automation investments, such as autonomous haul systems and process optimization, are delivering tangible cost reductions and paving the way for further operational efficiencies, thereby structurally improving competitive position, lowering operational risk, and supporting long-term net margin improvement.
Want to see what kind of revenue trajectory, margin rebuild, and future earnings multiple this narrative is baking in for Imperial Oil? The core assumptions behind that fair value rest on measured revenue growth, a step up in profitability, and meaningful support from buybacks in shrinking the share count, all filtered through a single discount rate and a specific earnings level several years out.
Result: Fair Value of CA$153.19 (OVERVALUED)
Have a read of the narrative in full and understand what's behind the forecasts.
However, Imperial Oil’s heavy exposure to oil sands and ongoing capital needs, along with sensitivity to crude price swings, could quickly challenge the current overvaluation story.
Find out about the key risks to this Imperial Oil narrative.
Another View: SWS DCF Model Sees Imperial Oil Differently
While analyst targets suggest Imperial Oil is about 10% overvalued at CA$169.02 versus CA$153.19, the SWS DCF model points the other way, with a future cash flow value of CA$239.26, or roughly 29.4% above the current share price. Which lens do you trust more for a long term hold?
Look into how the SWS DCF model arrives at its fair value.
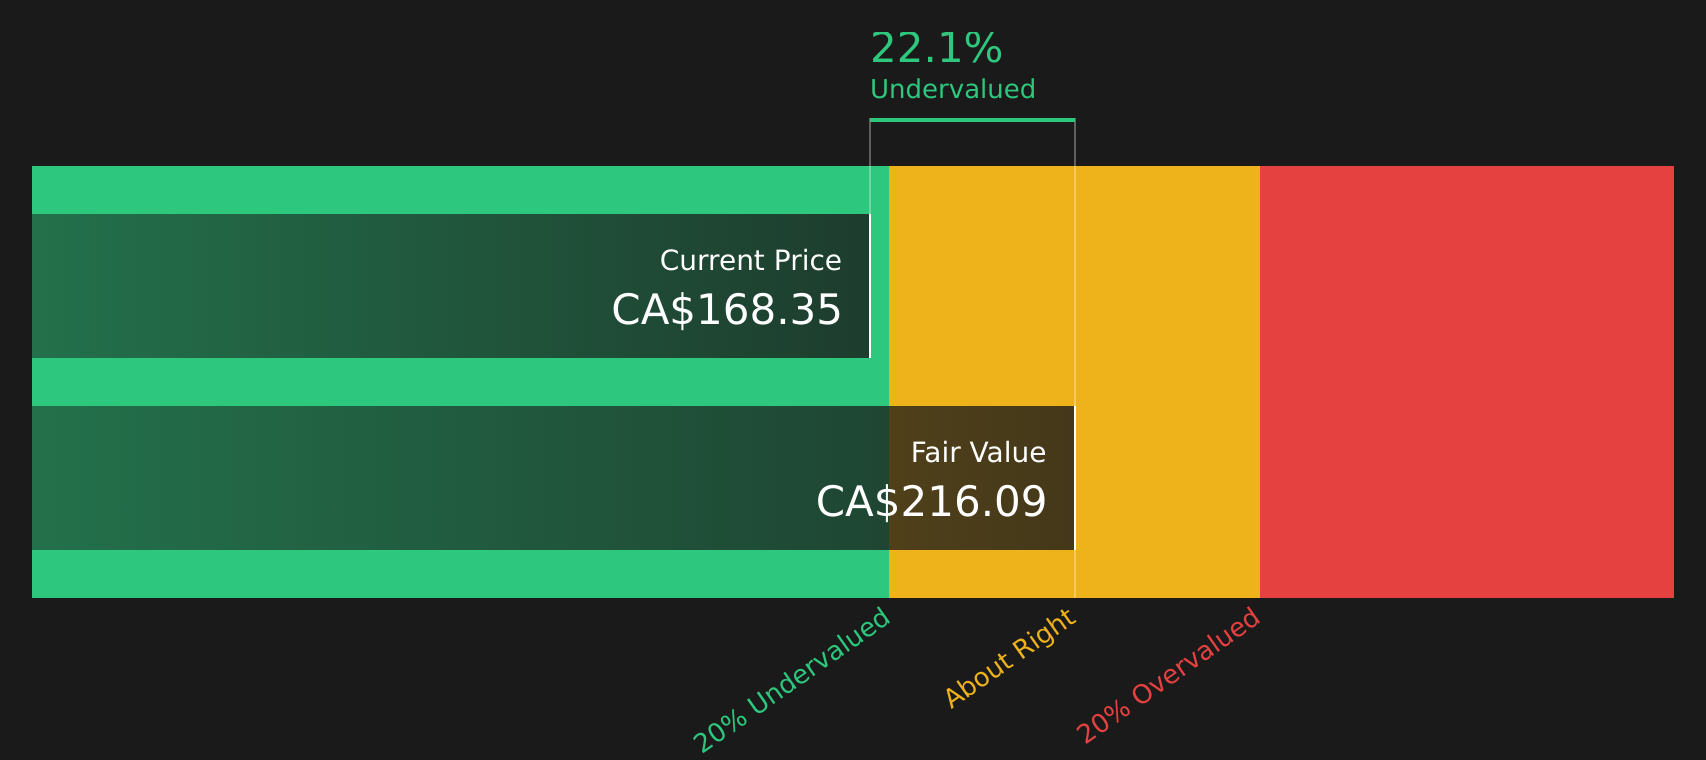
Simply Wall St performs a discounted cash flow (DCF) on every stock in the world every day (check out Imperial Oil for example). We show the entire calculation in full. You can track the result in your watchlist or portfolio and be alerted when this changes, or use our stock screener to discover 6 high quality undervalued stocks. If you save a screener we even alert you when new companies match - so you never miss a potential opportunity.
Next Steps
If the push and pull between upside potential and embedded risks around Imperial Oil feels finely balanced, now is the time to review the details yourself and weigh both sides of the story using the 3 key rewards and 1 important warning sign.
Looking for more investment ideas beyond Imperial Oil?
Imperial Oil might be front of mind today, but your next strong idea could come from a very different corner of the market, so do not let it slip past.
- Target resilient cash generators by scanning companies with dependable fundamentals using the solid balance sheet and fundamentals stocks screener (11 results).
- Hunt for potential mispriced opportunities by checking the 6 high quality undervalued stocks before others catch on.
- Prioritize stability and income by reviewing the 6 dividend fortresses that pair higher yields with disciplined payout profiles.
This article by Simply Wall St is general in nature. We provide commentary based on historical data and analyst forecasts only using an unbiased methodology and our articles are not intended to be financial advice. It does not constitute a recommendation to buy or sell any stock, and does not take account of your objectives, or your financial situation. We aim to bring you long-term focused analysis driven by fundamental data. Note that our analysis may not factor in the latest price-sensitive company announcements or qualitative material. Simply Wall St has no position in any stocks mentioned.
Have feedback on this article? Concerned about the content? Get in touch with us directly. Alternatively, email editorial-team@simplywallst.com