


Top European Dividend Stocks To Enhance Your Portfolio
As geopolitical tensions and energy market volatility weigh on European markets, investors are increasingly focused on the implications for inflation and monetary policy. With the pan-European STOXX Europe 600 Index down 1.79% recently, dividend stocks can offer a reliable income stream amid such uncertainty, providing stability through consistent payouts even as broader market conditions fluctuate.
Top 10 Dividend Stocks In Europe
| Name | Dividend Yield | Dividend Rating |
| Zurich Insurance Group (SWX:ZURN) | 4.08% | ★★★★★★ |
| Teleperformance (ENXTPA:TEP) | 8.63% | ★★★★★★ |
| Telekom Austria (WBAG:TKA) | 4.20% | ★★★★★★ |
| Swiss Re (SWX:SREN) | 4.88% | ★★★★★★ |
| Rubis (ENXTPA:RUI) | 6.60% | ★★★★★★ |
| Logista Integral (BME:LOG) | 5.93% | ★★★★★★ |
| Hannover Rück (XTRA:HNR1) | 5.00% | ★★★★★★ |
| Edel SE KGaA (XTRA:EDL) | 6.28% | ★★★★★★ |
| DKSH Holding (SWX:DKSH) | 3.80% | ★★★★★★ |
| Cembra Money Bank (SWX:CMBN) | 4.51% | ★★★★★★ |
Click here to see the full list of 212 stocks from our Top European Dividend Stocks screener.
Below we spotlight a couple of our favorites from our exclusive screener.
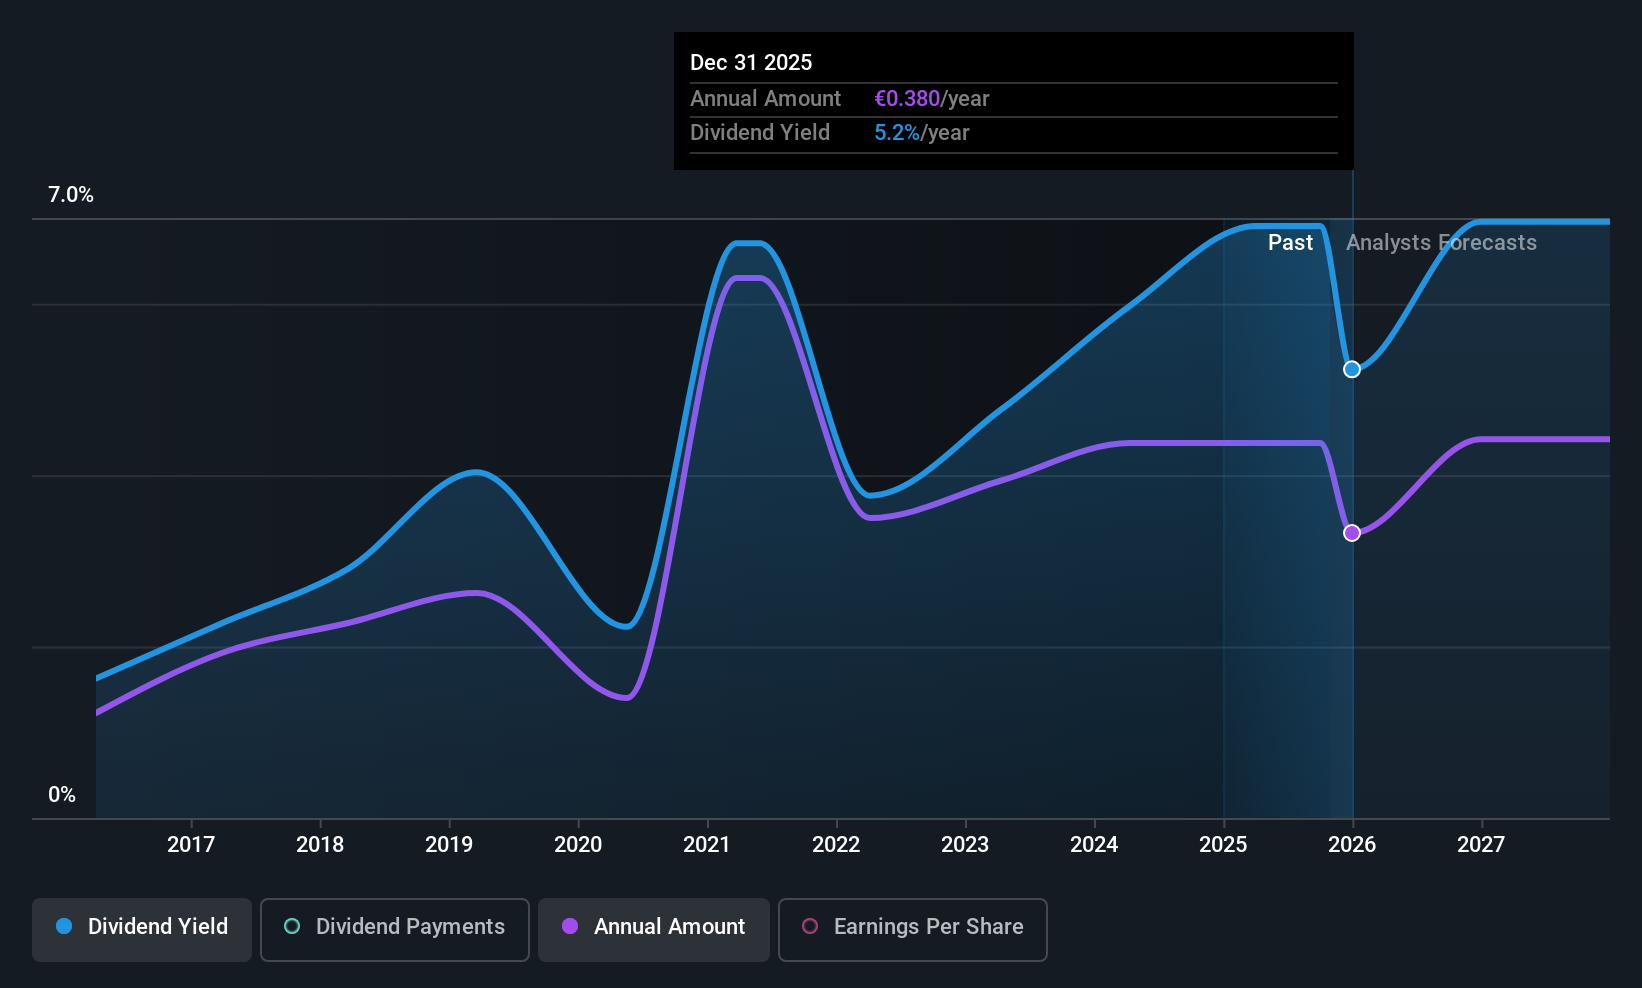
Taaleri Oyj (HLSE:TAALA)
Simply Wall St Dividend Rating: ★★★★☆☆
Overview: Taaleri Oyj is a publicly owned asset management holding company with a market cap of €207.24 million.
Operations: Taaleri Oyj generates its revenue primarily from the following segments: €22.34 million from Garantia, €5.86 million from Investments, and €31.78 million from Private Asset Management, which includes Renewable Energy and Other Private Asset Management activities.
Dividend Yield: 4.1%
Taaleri Oyj's dividend payments are well-covered by earnings, with a payout ratio of 49% and cash flow coverage at 76.9%. However, the dividend track record is unstable and has experienced volatility over the past decade. Despite trading at a significant discount to its estimated fair value, Taaleri's dividend yield of 4.08% is below the Finnish market's top tier. Recent initiatives include expanding into private credit, potentially enhancing long-term growth and diversification for investors seeking alternative financing solutions.
- Get an in-depth perspective on Taaleri Oyj's performance by reading our dividend report here.
- The analysis detailed in our Taaleri Oyj valuation report hints at an deflated share price compared to its estimated value.
SpareBank 1 SMN (OB:MING)
Simply Wall St Dividend Rating: ★★★★★☆
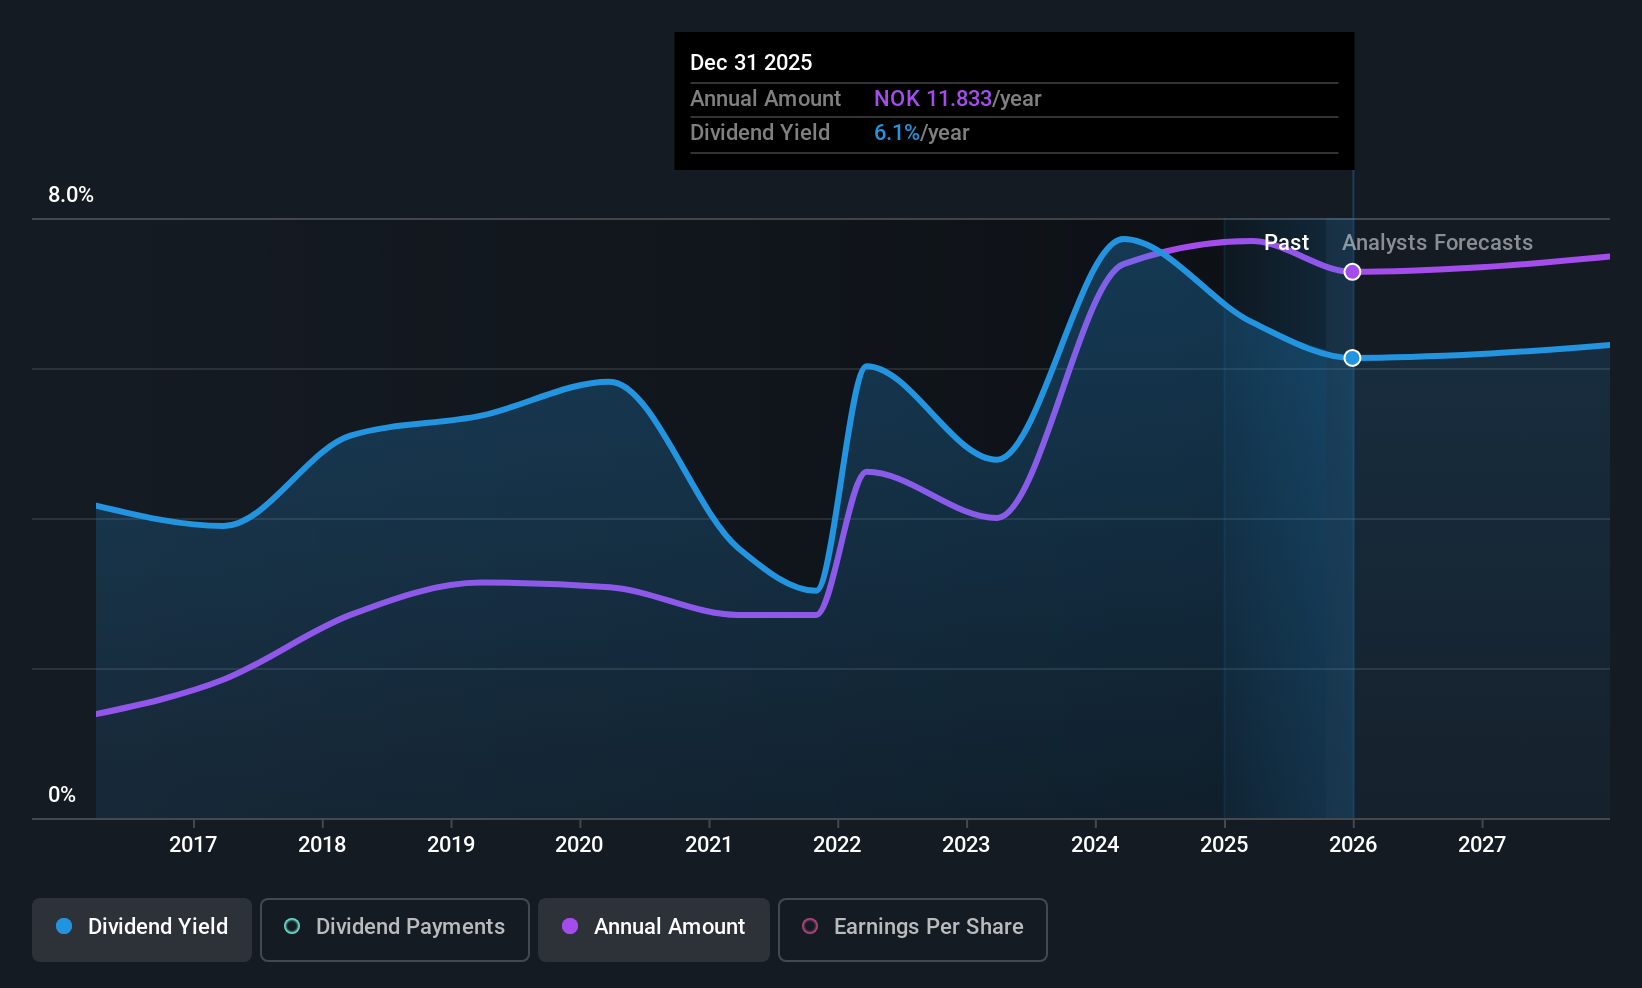
Overview: SpareBank 1 SMN, along with its subsidiaries, offers a range of banking, accounting, and real estate services to individuals and businesses both in Norway and internationally, with a market cap of NOK28.10 billion.
Operations: SpareBank 1 SMN generates revenue through several segments, including Retail Market (NOK3.18 billion), Corporate Market (NOK2.87 billion), Eiendoms Megler 1 (NOK580 million), Sparebank 1 Finans Midt-Norge (NOK410 million), and Sparebank 1 Regnskapshuset SMN (NOK858 million).
Dividend Yield: 6.9%
SpareBank 1 SMN's dividends have been reliable and stable over the past decade, with a current payout ratio of 73.3% indicating coverage by earnings. The dividend yield stands at 6.93%, slightly below Norway's top tier, yet attractive for income-focused investors. Recent financial activities include a €497.36 million fixed-income offering and a €10 billion shelf registration filing, suggesting strategic financial positioning despite recent declines in net income and interest income year-over-year.
- Navigate through the intricacies of SpareBank 1 SMN with our comprehensive dividend report here.
- Our valuation report here indicates SpareBank 1 SMN may be undervalued.
Wallenius Wilhelmsen (OB:WAWI)
Simply Wall St Dividend Rating: ★★★★☆☆
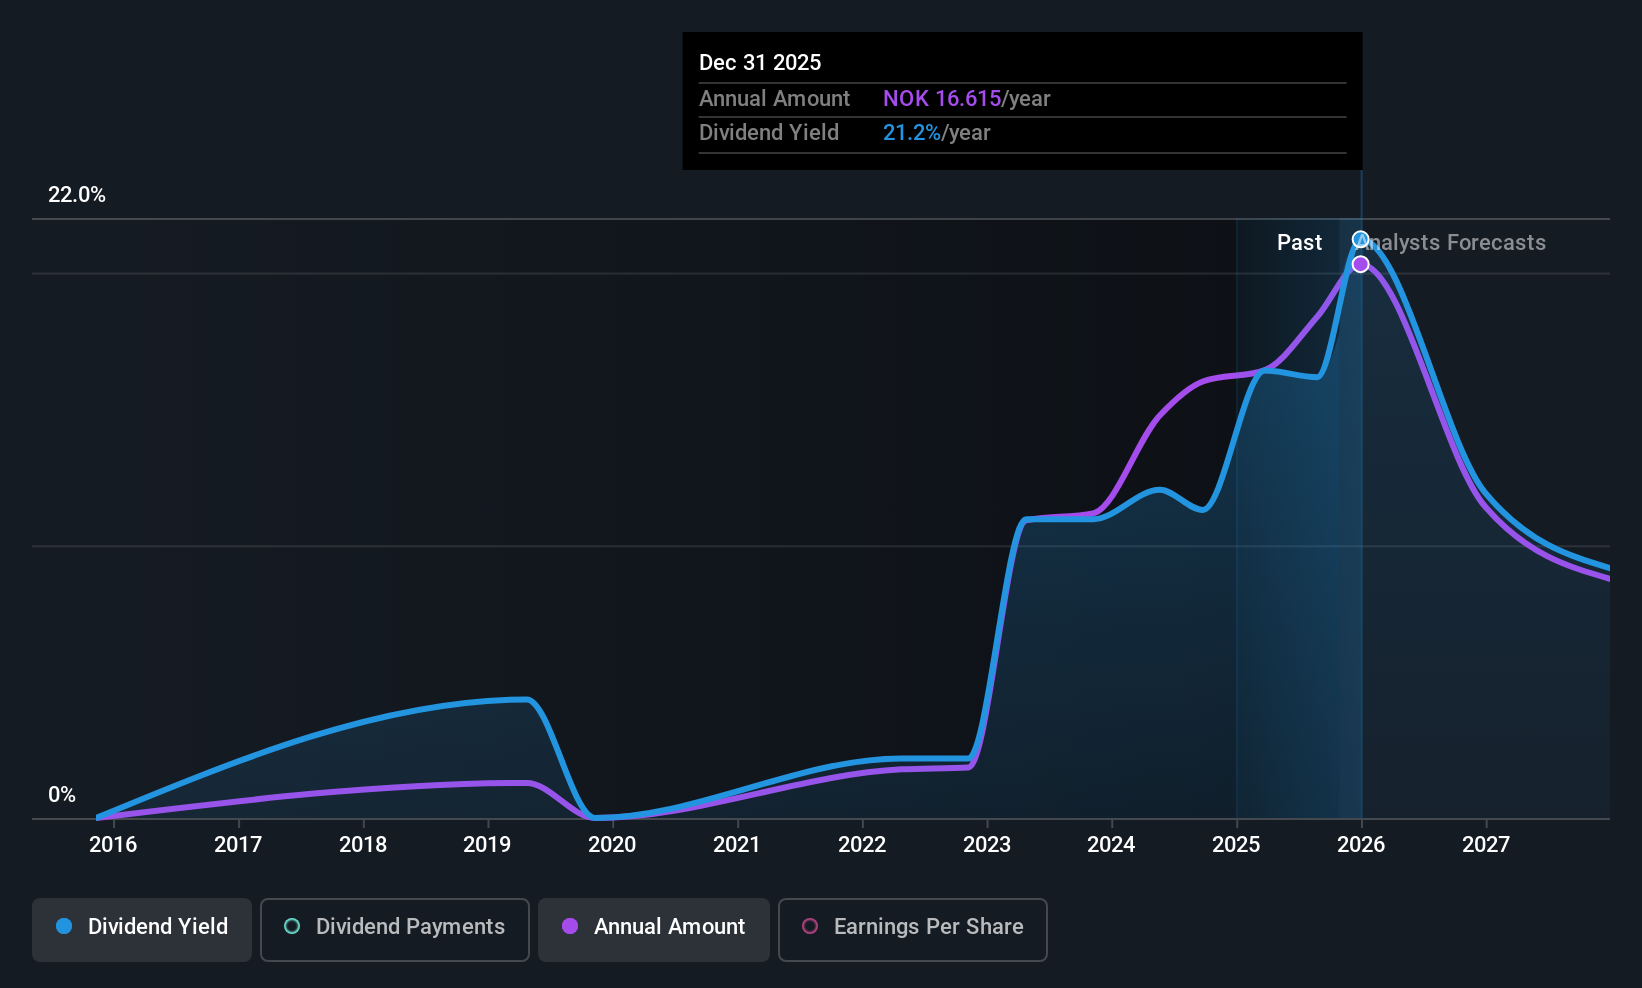
Overview: Wallenius Wilhelmsen ASA, with a market cap of NOK57.12 billion, operates globally in the logistics and transportation sector through its subsidiaries.
Operations: Wallenius Wilhelmsen ASA generates revenue from its Shipping Services at $3.96 billion, Logistics Services at $1.10 billion, and Government Services at $391 million.
Dividend Yield: 9.5%
Wallenius Wilhelmsen's dividend yield is in the top 25% of Norwegian payers, supported by a sustainable payout ratio of 58.2% and a cash payout ratio of 41.8%. However, dividends have been volatile over its short seven-year history, with earnings forecasted to decline significantly. Recent strategic contract extensions worth US$600 million provide some earnings visibility and stability, though past dividend reliability remains an issue for investors seeking consistent income growth.
- Click here and access our complete dividend analysis report to understand the dynamics of Wallenius Wilhelmsen.
- According our valuation report, there's an indication that Wallenius Wilhelmsen's share price might be on the cheaper side.
Next Steps
- Click through to start exploring the rest of the 209 Top European Dividend Stocks now.
- Are these companies part of your investment strategy? Use Simply Wall St to consolidate your holdings into a portfolio and gain insights with our comprehensive analysis tools.
- Enhance your investing ability with the Simply Wall St app and enjoy free access to essential market intelligence spanning every continent.
Ready To Venture Into Other Investment Styles?
- Explore high-performing small cap companies that haven't yet garnered significant analyst attention.
- Fuel your portfolio with companies showing strong growth potential, backed by optimistic outlooks both from analysts and management.
- Find companies with promising cash flow potential yet trading below their fair value.
This article by Simply Wall St is general in nature. We provide commentary based on historical data and analyst forecasts only using an unbiased methodology and our articles are not intended to be financial advice. It does not constitute a recommendation to buy or sell any stock, and does not take account of your objectives, or your financial situation. We aim to bring you long-term focused analysis driven by fundamental data. Note that our analysis may not factor in the latest price-sensitive company announcements or qualitative material. Simply Wall St has no position in any stocks mentioned.
Have feedback on this article? Concerned about the content? Get in touch with us directly. Alternatively, email editorial-team@simplywallst.com