


The resurgence of war between the US and Iran is fueling concerns about inflation! Bitcoin falls short of 200-week EMA “oil price-interest rate hike” fears strangle risky assets
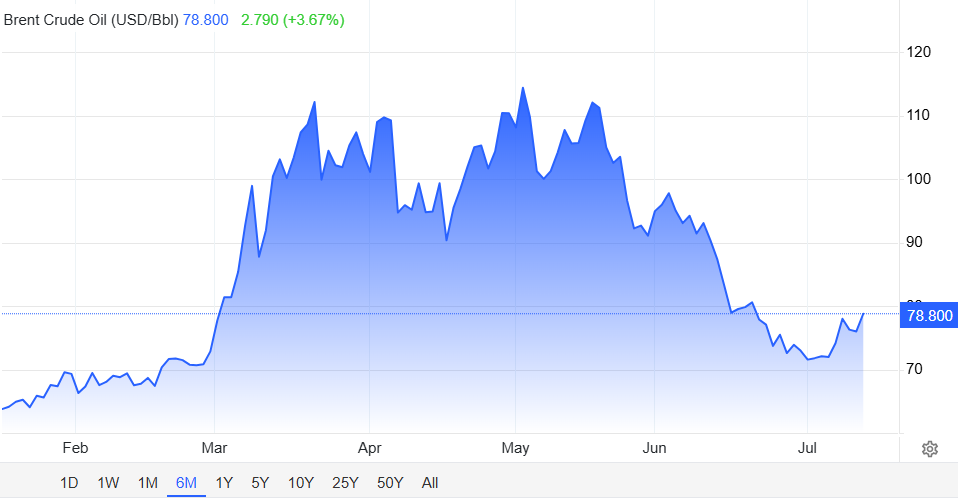
The Zhitong Finance App learned that the explosion in the Strait of Hormuz sounded once again, and hopes for a recovery that had just arisen in the cryptocurrency market were instantly dashed out. At the beginning of the Asia-Pacific session on Monday (July 13), Bitcoin once plummeted 2.4% to $62,600, falling below the 200-week moving average seen as the “bullbear dividing line.” According to CoinGlass data, more than 67,000 people around the world have closed their positions in the last 24 hours, and the total amount of liquidated positions reached 236 million US dollars. Ethereum fell 2.5% at the same time, and the three major US stock indexes, futures, gold, and silver dived across the board, while international oil prices rose sharply — WTI crude oil rose more than 3% to 74.1 US dollars/barrel, and Brent crude oil rose more than 3% to 78.8 US dollars/barrel.
War reignites in the Strait of Hormuz: just 25 days of cease-fire adds another variable
The confrontation between the US and Iran over the Strait of Hormuz escalated dramatically over the weekend. The US Central Command said that at 17:00 EST on the 12th, the US military began a new round of attacks on Iran, with the aim of “continuing to weaken its ability to attack merchant ships in the Strait of Hormuz.” This is the fourth time in a week that the US military has launched an attack on Iran — previously the US military had hit about 140 Iranian military targets, including missile and drone launch positions, naval equipment, and ammunition storage facilities.
The Iranian side quickly fought back. According to Iranian media reports in the early morning of the 13th, there were more than 10 explosions in the Bandar Abbas and Siriq regions in southern Iran, 5 explosions from Jask, and multiple explosions on Qeshm Island. The Islamic Revolutionary Guard Corps Navy of Iran announced in the early morning of the 12th that the Strait of Hormuz will be closed from now until further notice.
Only 25 days have passed since the US and Iran signed a memorandum of understanding in mid-June, and the cease-fire agreement is in vain. Iran's Ministry of Foreign Affairs denounced in a statement that the US government “almost blatantly violated the entire content of the agreement.” Meanwhile, US President Trump insisted in an interview that the Strait of Hormuz was “unobstructed” and blamed Iran.
Both sides hold their own opinions, but the market only recognizes one fact: this energy throat, which carries about 20% of the world's crude oil and LNG transportation, has once again fallen into a state of high uncertainty.
Market chain reaction: the “chain of inflationary fears” from oil prices to interest rates
The sharp rise in oil prices is activating one of the transmission paths most feared by the market. The sharp rise in oil prices is the starting point of the chain. Brent crude jumped from around $72 to over $78, an increase of more than 3%. The new round of attacks is compounded by news that Iran will expand the scope of the attack to Qatar and the UAE over the weekend. The market is digesting the risk that actual shipping volume in the Strait of Hormuz will continue to shrink.
Inflation expectations have heated up. Energy prices are the most sensitive front-end indicator of inflation. The Federal Reserve's monetary policy report to Congress on Friday warned that US inflation will heat up further this spring due to “rising war-related energy costs due to the Gulf conflict.”
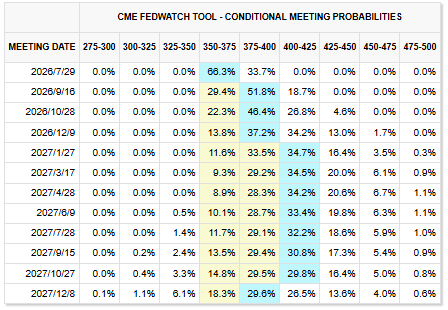
Expectations of interest rate hikes followed. The bitmap of the June FOMC meeting shows that 9 out of 18 policy officials expect to raise interest rates within 2026. Markets worry that if oil prices continue to rise and CPI exceeds expectations, the Federal Reserve may take more hawkish action at the July 28-29 meeting. According to the CME Federal Reserve's observation tool, the market generally expects the Fed to raise interest rates at least once this year, and the probability of raising interest rates in September is over 50%.
As a result, risk assets are under pressure. As a speculative asset with no return, Bitcoin's appeal naturally declined in an environment of rising interest rates. Although gold has safe-haven properties, it was also sold off under the logic of “oil prices drive inflation, inflation drives interest rate hikes” — spot gold fell below 4,100 US dollars/ounce, a drop of more than 1%.
Richard Galvin, executive chairman of cryptocurrency investment company DACM, said bluntly: “This wave of sell-offs is due to the sharp rise in oil prices due to weak US stock index futures trading and the increasingly tense situation in Iran.”
Red light on the technical side: the historical significance of the 200-week EMA failure
The most alarming sign of this decline is that Bitcoin has fallen below the 200-week moving average. This moving average has been seen as the iconic support for Bitcoin's bottom of every bear market since 2015. It smoothed out nearly four years of weekly prices, filtered out everyday noise, and previously accurately captured the bottom of every major cycle in Bitcoin's history.
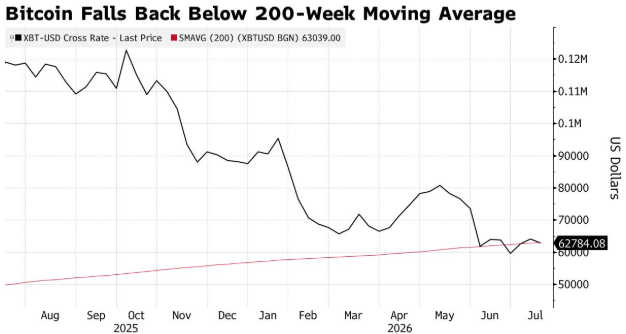
Currently, the EMA is in the range of about $59,000 to $61,000. Bitcoin has fallen below this line at the close of June, the first time this has happened since the last round of the bear market. Several analysts have warned that if this moving average fails, the next deeper bottom support will be aggregated across the network to achieve a price of around $54,000 to $54,900.
IG Australia analyst Tony Sycamore warned: “The higher-than-expected CPI data may reinforce market expectations that the Federal Reserve will raise interest rates before the end of the year, which will put pressure on Bitcoin.”
A glimmer of light: ETF ends eight weeks of outflows, but strength is limited
Amidst all the pessimism, there is still a positive sign worth watching. The US Bitcoin Spot ETF recorded a net inflow of US$197.4 million in the week ending July 10, putting an end to the eight consecutive weeks of net outflows since May. Among them, BlackRock's iShares Bitcoin Trust (IBIT.US) became the main driving force, absorbing up to 291.9 million US dollars in a single week.
However, this reversal is still not strong enough. Investors have withdrawn approximately $8.26 billion from these funds since May 11. The latest inflow of $197.4 million accounts for only about 2.4% of the amount previously withdrawn. As the analysts pointed out, this is a “sign of recovery worth watching, but it's still in its early stages.”
This Week's 'Super Risk Window': CPI+ Walsh Congress Debuts
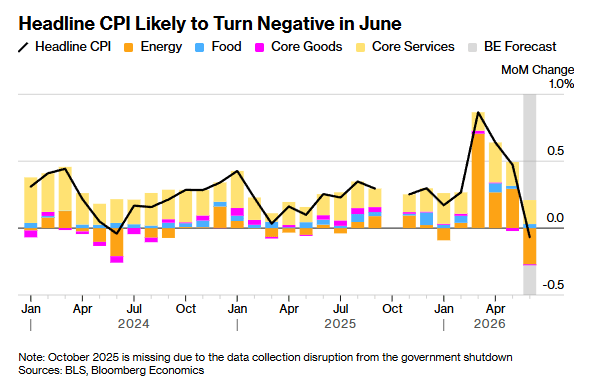
The real test for the market is yet to come. On Tuesday (July 14), the US Bureau of Labor Statistics will release the June CPI data. The market expects overall CPI to drop 0.1% month-on-month and core CPI to rise 0.3% month-on-month. But if actual data is biased — considering the lagging effects of the recent surge in oil prices — it will directly reinforce expectations of the Federal Reserve's interest rate hike. The current CPI is still as high as 4.2% year over year, far higher than the Federal Reserve's year-end PCE forecast of 3.6%.
On the same day, Federal Reserve Chairman Kevin Walsh will testify for the first time in Congress as chairman. According to the arrangement, he will attend the House Financial Services Committee hearing on July 14 and the Senate Banking Committee hearing on July 15. The market will pay close attention to any changes in his wording regarding interest rate paths, inflation judgments, and balance sheet policies.
At the June FOMC meeting, Walsh clearly opposed issuing forward-looking policy guidelines, which means that the market will rely entirely on economic data to determine policy trends in the future. This week's CPI data and Walsh's statement will be the key basis for the market to determine whether to raise interest rates at the July 28-29 FOMC meeting.
Sycamore added that if the CPI data is at or below expectations, it will confirm Walsh's previous view that inflationary pressure is easing.
The “oil price-inflation-interest rate hike” chain has started again
Bitcoin is experiencing a “passive sell-off” dominated by external macro forces — the price is driven not by structural changes within the crypto market, but by the explosion in the Strait of Hormuz, a sharp jump in oil prices, and the repricing of the Federal Reserve's interest rate hike.
The current price of Bitcoin is still about 50% lower than its historical high in October 2025, and the overall market sentiment is still lackluster. The volatility of the cryptocurrency market is likely to increase further under the multiple pressures of the ongoing escalation of the US-Iran conflict, the imminent release of inflation data, and the unresolved policy path of the Federal Reserve.
This week's CPI data and Walsh's congressional testimony will be key variables in determining whether Bitcoin can hold the $60,000 mark. If inflation exceeds expectations and Walsh sends hawkish signals, Bitcoin may fall further to the “realized price” area of $54,000 to $55,000. If the data is moderate and Walsh's wording is balanced, the inflow of $197.4 billion in ETF funds may be an early sign of an inflection point in sentiment.
Currently, Bitcoin's pricing power is increasingly in the hands of the Hormuz Strait waterways and Federal Reserve Chairman's speeches rather than the crypto market's own narratives.