


Round 3: Why Volatility Can Make or Break a Commodity Spread
Dual Edge Research publishes two powerful newsletters that work great individually — and even better together. The Bull Strangle Newsletter focuses on stocks and options, combining stock ownership with premium-selling strategies to generate consistent income and market-beating returns. The Smart Spreads Newsletter specializes in seasonal commodity futures spreads, offering a diversified approach with low correlation to equities. Together, they deliver a complete investment perspective — one focused on income, the other on diversification — all under one simple subscription.
Introduction
In my previous two articles, I introduced the idea that finding the highest-quality seasonal commodity spreads is a process of elimination. Every historical trade begins in Round 1, where we ask:
- Should we Buy or Sell?
From there, surviving opportunities advance to Round 2, where we determine the best spread structure:
- Should we trade a 2-leg, 3-leg, or 4-leg spread?
Today, we move to Round 3, where we narrow the field even further by asking an equally important question:
- Under what volatility conditions has this trade historically performed best?
As we'll see, two identical seasonal spreads entered at different points in the forward curve can produce dramatically different historical results.
Round 1 – Choosing Direction
The first filter immediately removes half of the possible trades. Some markets have a very clear directional edge. For example:
- Heating Oil strongly favored BUYING
- Soybeans strongly favored SELLING
- Lean Hogs produced profitable results on both sides, although BUY opportunities were much less frequent.
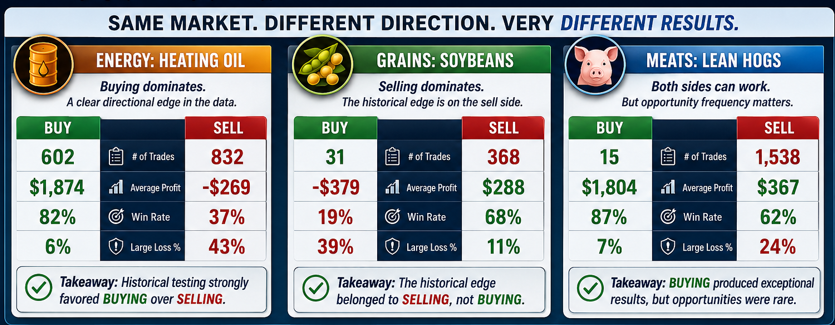
By identifying the historically superior direction first, we eliminate trades that have consistently underperformed over decades of historical testing.
Round 2 – Choosing the Right Structure
After the direction is selected, we determine the optimal construction of the spread. Sometimes adding additional legs improves the trade. Natural Gas BUY spreads nearly tripled average profits while reducing large losses when a third leg was added. Other markets behaved very differently. Corn SELL spreads performed best with a traditional 2-leg structure. Lean Hogs BUY spreads actually lost much of their historical edge when a third leg was added.
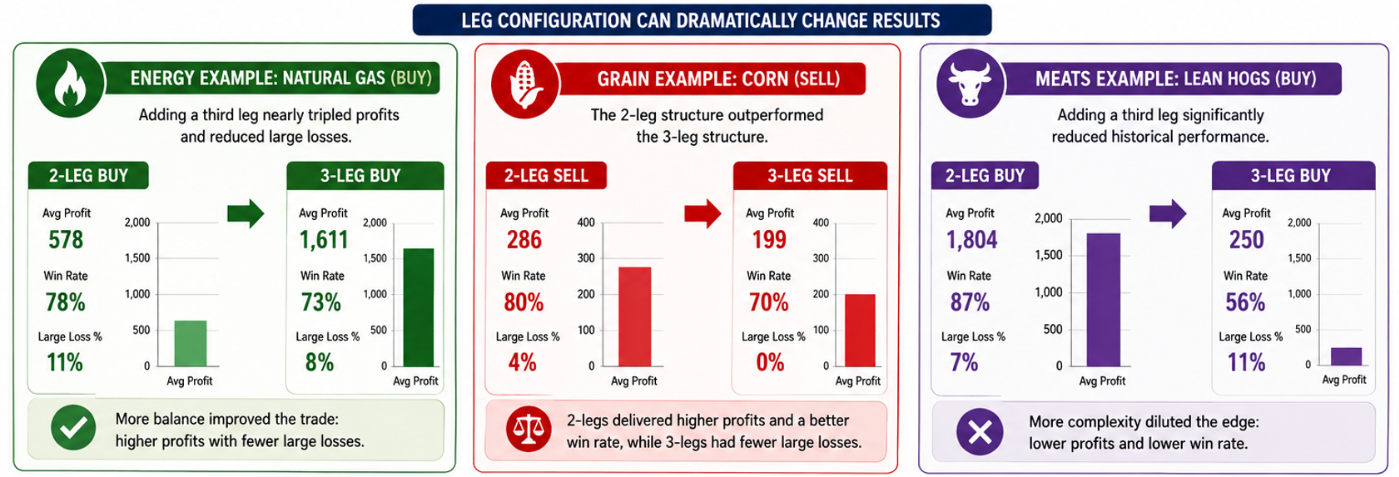
Again, historical testing allows us to remove additional lower-quality candidates before a trade ever reaches the watch list.
Round 3 – Introducing Volatility
Now we arrive at the final layer. Even after selecting the proper direction and leg configuration, not every opportunity is equally attractive. The remaining trades are classified into High, Mid, and Low Volatility environments. Unlike implied volatility used in options, this volatility classification is based entirely on contract structure. Two measurements determine the volatility category:
1. Time from entry to expiration of the front contract - Generally, the closer the front month is to expiration, the more volatile price movements become.
2. Time between the front and back contracts - Spreads with contracts farther apart typically experience greater price movement than nearby calendar spreads.
Together, these two measurements create a practical estimate of the expected volatility of each spread.
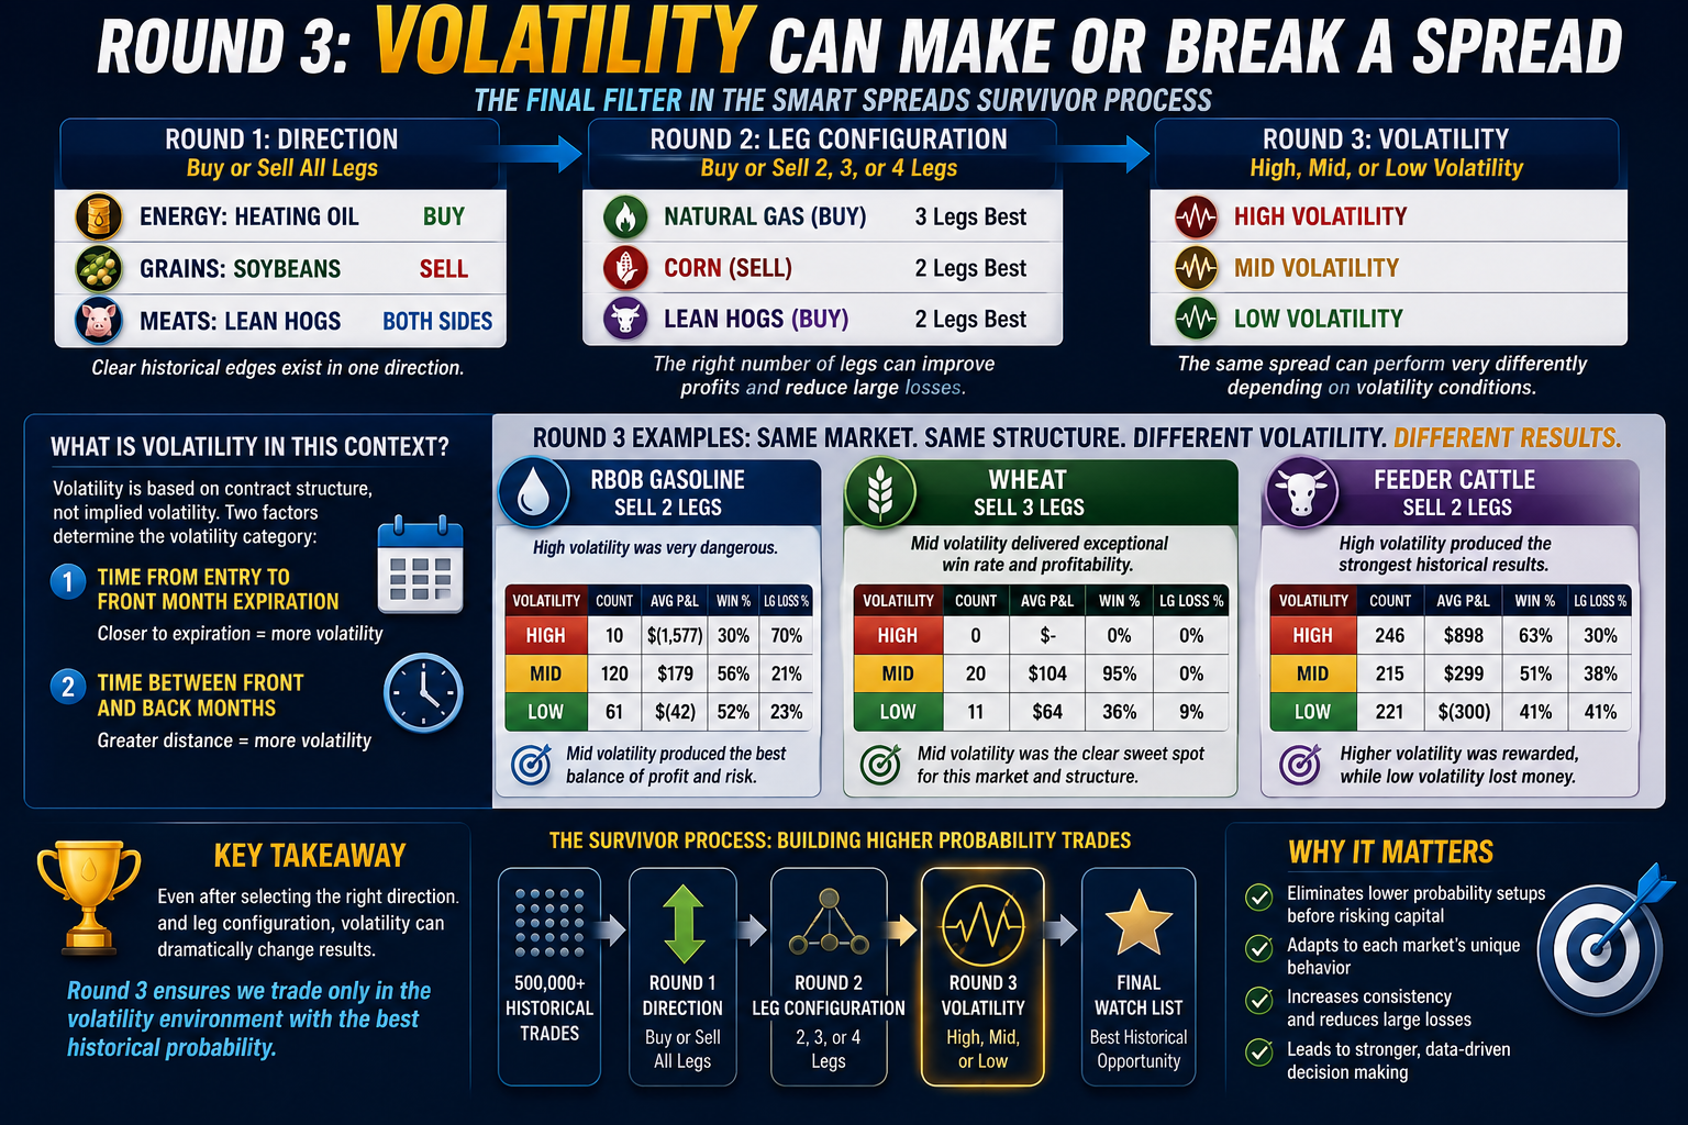
Three Examples. The impact can be dramatic.
RBOB Gasoline (2-Leg SELL) - High-volatility trades averaged a $1,577 loss, with 70% becoming large losers. Mid-volatility trades averaged a $179 profit while cutting the large-loss rate to 21%. Simply avoiding the highest-volatility setups dramatically improved historical performance.
Wheat (3-Leg SELL) - This example tells a different story. Mid-volatility trades produced exceptional consistency, winning 95% of the time. Both higher- and lower-volatility environments produced far fewer opportunities and less attractive results.
Feeder Cattle (2-Leg SELL) - Here, the relationship is almost the opposite. High-volatility environments generated the strongest average profits at $898, while lower-volatility trades actually lost money on average.
Conclusion
This reinforces one of the central themes of Smart Spreads:
- There are very few universal rules.
Every market has its own personality.
Why This Matters
By the time a trade reaches Round 3, it has already survived multiple layers of objective screening. Rather than relying solely on seasonal tendencies, we're now evaluating:
- Direction
- Spread structure
- Volatility environment
Each round removes additional lower-quality candidates and increases confidence that the remaining opportunities possess the strongest historical characteristics.
Looking Ahead
Volatility represents the final stage of the survivor process. Beginning with hundreds of thousands of historical spread combinations, each round systematically eliminates weaker candidates until only the strongest historical opportunities remain. That process—rather than any single indicator—is what ultimately produces the Smart Spreads watch list.
Additional Details
The Bull Strangle Newsletter focuses on stocks and options, combining stock ownership with disciplined option-selling techniques designed to generate consistent income while managing risk.
The Smart Spreads Newsletter focuses on seasonal commodity spreads, a historically proven approach that seeks opportunities across agricultural, energy, metal, and financial futures markets.
Each strategy is designed to stand on its own, but together they provide a diversified approach that can perform across a wide range of market environments. For traders looking to deepen their education, The Bull Strangle Strategy and Trading Commodity Spreads, both available on Amazon.
Visit BullStrangle.com to subscribe for just $1 for the first month.
For a video overview of the Bull Strangle Newsletter
For a video overview of the Smart Spreads Newsletter
Darren Carlat
Dual Edge Research
(214) 636-3133
DualEdgeResearch@gamil.com
Disclaimer
This information is for informational purposes only and should not be considered as investment advice. Past performance is not indicative of future results, and all investments carry inherent risk. Consult with a financial advisor before making any investment decisions.