


KKR (KKR) Stock Looks Undervalued On Fair Value But Overvalued On Earnings
KKR stock is coming off a weak year but still shows a 73.6% gain over the past 5 years, while its valuation checks send mixed signals as the intrinsic value estimate from the Excess Returns model points to upside and the market multiple view leans in the opposite direction. That split sits against a backdrop of renewed activity in renewables, infrastructure and healthcare transactions, all of which can influence how investors think about what KKR is worth today.
- Over 5 years, KKR has returned 73.6%, which means long term holders have been rewarded even though the past year has been challenging.
- Large transactions in areas such as renewable energy and AI focused digital infrastructure can support expectations for future fee and investment income, while concerns around private credit exposure and legal disputes related to affiliated vehicles may weigh on how much risk investors are willing to price in.
- On Simply Wall St's broader checks, KKR scores 3 out of 6 on valuation, which points to a mixed picture rather than a clear bargain or clear overvaluation.
The issue now is whether KKR's current share price already reflects its deal pipeline and business mix, or if the intrinsic value estimate still leaves a margin of upside.
Find out why KKR's -30.8% return over the last year is lagging behind its peers.
Is KKR a Bargain on Excess Returns?
The Excess Returns model looks at how much value KKR can create over and above the return investors require on its equity capital. For KKR, the model starts with a Book Value of $31.43 per share and a Stable EPS estimate of $9.12 per share, based on weighted future return on equity estimates from 4 analysts.
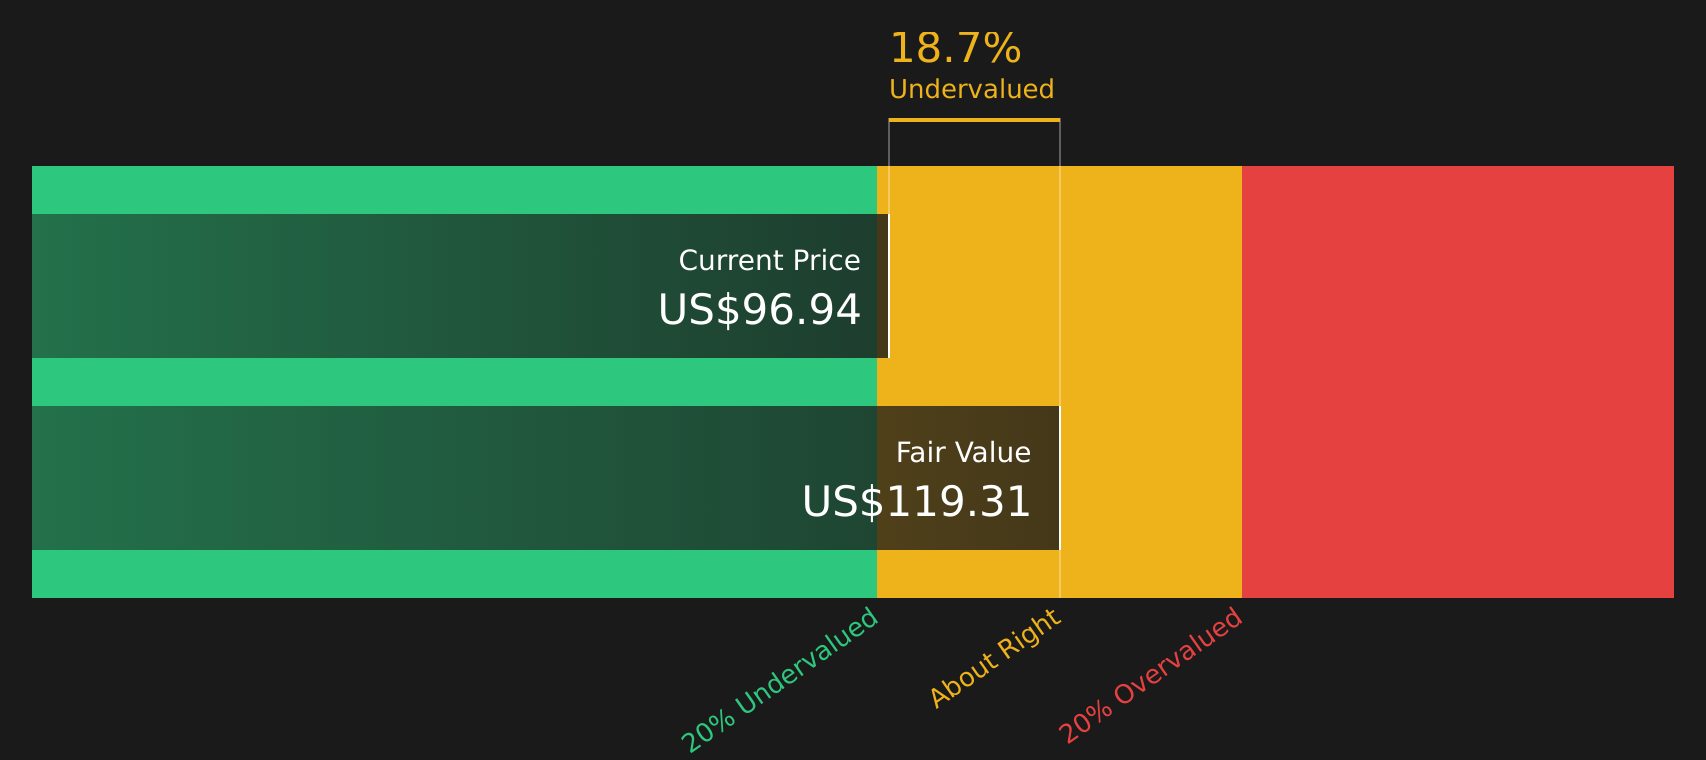
With a Cost of Equity of $6.32 per share and an Excess Return of $2.80 per share, the model assumes an Average Return on Equity of 13.20% on a growing Stable Book Value that is projected at $69.08 per share, again using analyst-based book value estimates. Pushing those excess returns forward gives an intrinsic value estimate of $119.02 per share, which is about 18.6% above the current share price implied by this model, so KKR screens as undervalued on this basis.
Because KKR is actively expanding in renewables through deals such as the $4.2b acquisition of EDF’s North American renewable operations, the current discount may partly reflect how investors are weighing the execution and risk around those commitments.
Overall, the Excess Returns workup suggests KKR stock appears undervalued relative to the value implied by its projected returns on equity within this model framework.
Our Excess Returns analysis suggests KKR is undervalued by 18.6%. Track this in your watchlist or portfolio, or discover 44 more high quality undervalued stocks.
Has KKR Run Too Far on Earnings?
P/E tends to be a useful cross check for KKR because earnings are a key focus for investors in large alternative asset managers. KKR currently trades on a P/E of 31.1x, compared with a peer average of 22.9x and a broader capital markets industry average of 40.4x, so the stock sits at a premium to closer peers but below the wider sector.
Simply Wall St's fair P/E, which reflects the earnings profile and risk of KKR, is 25.2x. That is below the current 31.1x and indicates the stock screens as overvalued on this tailored multiple, even though it does not sit at the most expensive end of the industry. The premium multiple comes alongside active investment in areas like renewables, infrastructure and healthcare, which may be influencing how much investors are prepared to pay for KKR's earnings today.
Overall, KKR stock appears overvalued on the P/E multiple compared with the level suggested by the fair ratio model.

See what the numbers say about this price — find out in our valuation breakdown.
The KKR Narrative: What Would Justify Today's Price?
Simply Wall St Narratives for KKR pick up where the valuation split leaves off by spelling out which paths for KKR's growth, margins and earnings would need to hold for the stock to be worth significantly more or less than it is today. These narratives sit on the company’s Community page. Each narrative links its number to a clear view of how KKR's growth, profitability and risk profile could evolve, giving you something concrete to revisit as fresh information comes through.
Community views on KKR split sharply, with one side focused on fee power and recurring earnings, and the other fixated on credit risk and complexity.
Bull case: 31% undervalued
"Strong and accelerating fundraising momentum across asset classes, especially with institutional investors and the fast-growing private wealth/retail segment, are expanding fee-paying AUM and supporting double-digit management fee growth…"
Read the full Bull Case to see why KKR could be undervalued
Bear case: 15% overvalued
"El crédito privado puede ocultar deterioro latente…"
Read the full Bear Case to see why KKR could be overvalued
Do you think there's more to the story for KKR? Head over to our Community to see what others are saying!
The Bottom Line
For KKR, the Excess Returns intrinsic value estimate points to upside, while the P/E view suggests the stock is priced at a premium to what its fair ratio implies, so the two frameworks do not line up neatly. The broader checks sit in the middle, which fits with a picture that is neither a clear bargain nor clearly expensive. The gap between models largely reflects how much weight you put on KKR’s projected return on equity versus current market expectations baked into the multiple. The key question from here is whether KKR’s deal pipeline and fee potential justify that premium, or whether risks in private credit and complex structures deserve a larger discount.
This article by Simply Wall St is general in nature. We provide commentary based on historical data and analyst forecasts only using an unbiased methodology and our articles are not intended to be financial advice. It does not constitute a recommendation to buy or sell any stock, and does not take account of your objectives, or your financial situation. We aim to bring you long-term focused analysis driven by fundamental data. Note that our analysis may not factor in the latest price-sensitive company announcements or qualitative material. Simply Wall St has no position in any stocks mentioned.
Have feedback on this article? Concerned about the content? Get in touch with us directly. Alternatively, email editorial-team@simplywallst.com