


Wyndham Hotels & Resorts (WH) Could Be 22% Below Fair Value On Value Interest
Recent coverage of Wyndham Hotels & Resorts (WH) focuses on its share price trading below one estimate of fair value, along with a solid third party performance score, which has put potential value opportunities on investors’ radars.
See our latest analysis for Wyndham Hotels & Resorts.
At a share price of $78.54, Wyndham Hotels & Resorts has seen short term share price weakness, with the 7 day return down 4.70% and the 90 day return down 8.32%. The year to date share price return of 4.34% and 5 year total shareholder return of 26.44% point to a steadier longer term record, even as recent insider selling and debate around development projects keep attention on risk and valuation.
If this kind of value debate has your attention, it could be a good moment to broaden your search with 18 top founder-led companies
Bulls point to Wyndham Hotels & Resorts trading below one fair value estimate and its strong third party score, while bears focus on insider selling and project risks. So how do the numbers stack up when you run through the valuation?
Most Popular Narrative: 21.6% Undervalued
With Wyndham Hotels & Resorts last closing at $78.54 against a narrative fair value of about $100.18, the valuation debate shifts to whether the underlying earnings assumptions truly support that gap.
Record development pipeline growth, with contract signings up 40% and new, high FeePAR-accretive hotels comprising a larger share of additions, enhances base royalty rate accretion and fee-related revenue, directly supporting higher net margins and long-term earnings potential.
Curious what sits behind that projected jump in fee income and margins? The narrative leans heavily on compounded earnings growth, rising profitability and a richer revenue mix. Want to see how those moving parts line up against that $100 fair value call in detail?
Result: Fair Value of $100.18 (UNDERVALUED)
Have a read of the narrative in full and understand what's behind the forecasts.
However, there are still pressure points for Wyndham Hotels & Resorts, including softer recent total returns and reputational risks related to franchise quality or safety issues.
Find out about the key risks to this Wyndham Hotels & Resorts narrative.
Another View: SWS DCF Model Puts a Different Price on Wyndham Hotels & Resorts
While the analyst narrative suggests Wyndham Hotels & Resorts could be trading below a fair value of about $100.18, the SWS DCF model points the other way, with an estimated future cash flow value of $69.89 against the current $78.54 share price, implying the stock screens as overvalued on this method.
For investors, that kind of gap between a forward earnings story and a cash flow based estimate raises a simple question: which set of assumptions feels more realistic for how Wyndham Hotels & Resorts might actually generate cash over time?
Look into how the SWS DCF model arrives at its fair value.
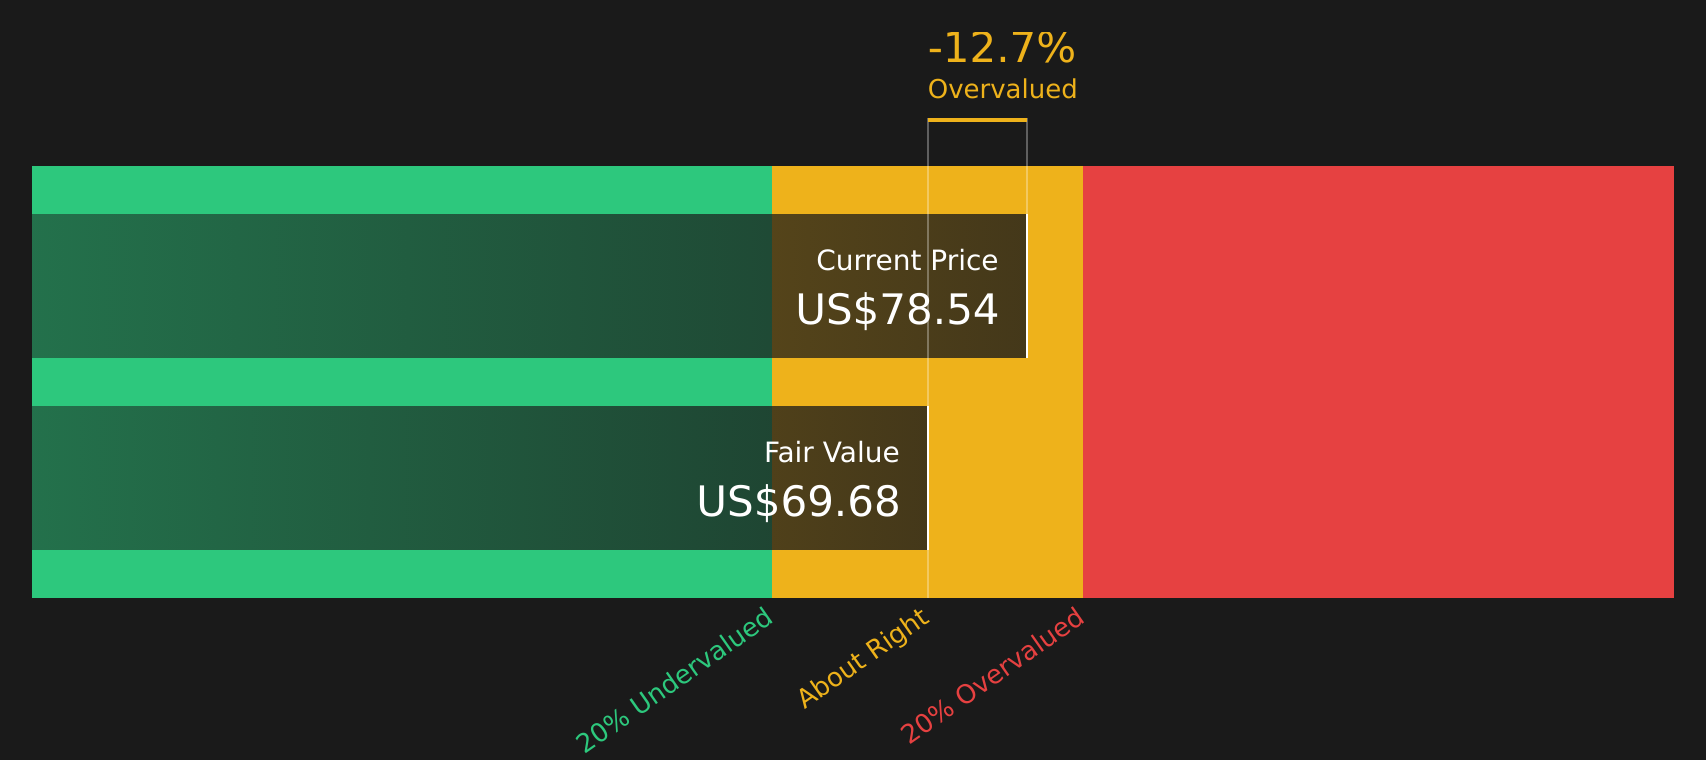
Simply Wall St performs a discounted cash flow (DCF) on every stock in the world every day (check out Wyndham Hotels & Resorts for example). We show the entire calculation in full. You can track the result in your watchlist or portfolio and be alerted when this changes, or use our stock screener to discover 44 high quality undervalued stocks. If you save a screener we even alert you when new companies match - so you never miss a potential opportunity.
Next Steps
With mixed signals on valuation and sentiment around Wyndham Hotels & Resorts, it makes sense to move quickly, review the figures in full, and weigh both the upside potential and risk flags highlighted by the 2 key rewards and 5 important warning signs
Looking for more investment ideas beyond Wyndham Hotels & Resorts?
Do not just stop at Wyndham Hotels & Resorts. Broaden your watchlist with fresh ideas that match your style, from income to quality balance sheets and potential mispricing.
- Target powerful income opportunities by scanning for established businesses offering robust yields with 9 dividend fortresses
- Spot potential mispriced opportunities early by running the screener containing 19 high quality undiscovered gems before the crowd catches on.
- Protect your downside by focusing on financially resilient companies through the 76 resilient stocks with low risk scores
This article by Simply Wall St is general in nature. We provide commentary based on historical data and analyst forecasts only using an unbiased methodology and our articles are not intended to be financial advice. It does not constitute a recommendation to buy or sell any stock, and does not take account of your objectives, or your financial situation. We aim to bring you long-term focused analysis driven by fundamental data. Note that our analysis may not factor in the latest price-sensitive company announcements or qualitative material. Simply Wall St has no position in any stocks mentioned.
Have feedback on this article? Concerned about the content? Get in touch with us directly. Alternatively, email editorial-team@simplywallst.com