


3 European Stocks Estimated To Be Trading 44.3% To 49.8% Below Intrinsic Value
As the European markets experience a positive shift with the STOXX Europe 600 Index rising by 1.96% and major indices like Germany's DAX and France's CAC 40 showing gains, investors are increasingly focused on stocks that may be trading below their intrinsic value. In such an environment, identifying undervalued stocks involves analyzing companies with strong fundamentals that have not yet been fully recognized by the market, offering potential opportunities for growth as conditions stabilize.
Top 10 Undervalued Stocks Based On Cash Flows In Europe
| Name | Current Price | Fair Value (Est) | Discount (Est) |
| Troax Group (OM:TROAX) | SEK101.80 | SEK197.99 | 48.6% |
| TGS (OB:TGS) | NOK132.00 | NOK255.07 | 48.2% |
| Netcompany Group (CPSE:NETC) | DKK320.20 | DKK637.29 | 49.8% |
| Micro Systemation (OM:MSAB B) | SEK81.80 | SEK159.17 | 48.6% |
| Laboratorios Farmaceuticos Rovi (BME:ROVI) | €56.15 | €109.13 | 48.5% |
| Koskisen Oyj (HLSE:KOSKI) | €8.84 | €17.54 | 49.6% |
| Gabriel Holding (CPSE:GABR) | DKK268.00 | DKK518.35 | 48.3% |
| F-Secure Oyj (HLSE:FSECURE) | €1.994 | €3.90 | 48.9% |
| Elekta (OM:EKTA B) | SEK50.85 | SEK98.27 | 48.3% |
| Appear (OB:APR) | NOK47.50 | NOK94.25 | 49.6% |
Here's a peek at a few of the choices from the screener.
Netcompany Group (CPSE:NETC)
Overview: Netcompany Group A/S provides IT solutions to private and public customers across several countries including Denmark, Norway, the United Kingdom, and others, with a market cap of DKK14.40 billion.
Operations: The company's revenue is derived from providing IT solutions, with DKK3.21 billion from Denmark, DKK2.71 billion from See & Eui, DKK765.30 million from the United Kingdom, DKK367.10 million from Norway, and DKK216.50 million from the Netherlands.
Estimated Discount To Fair Value: 49.8%
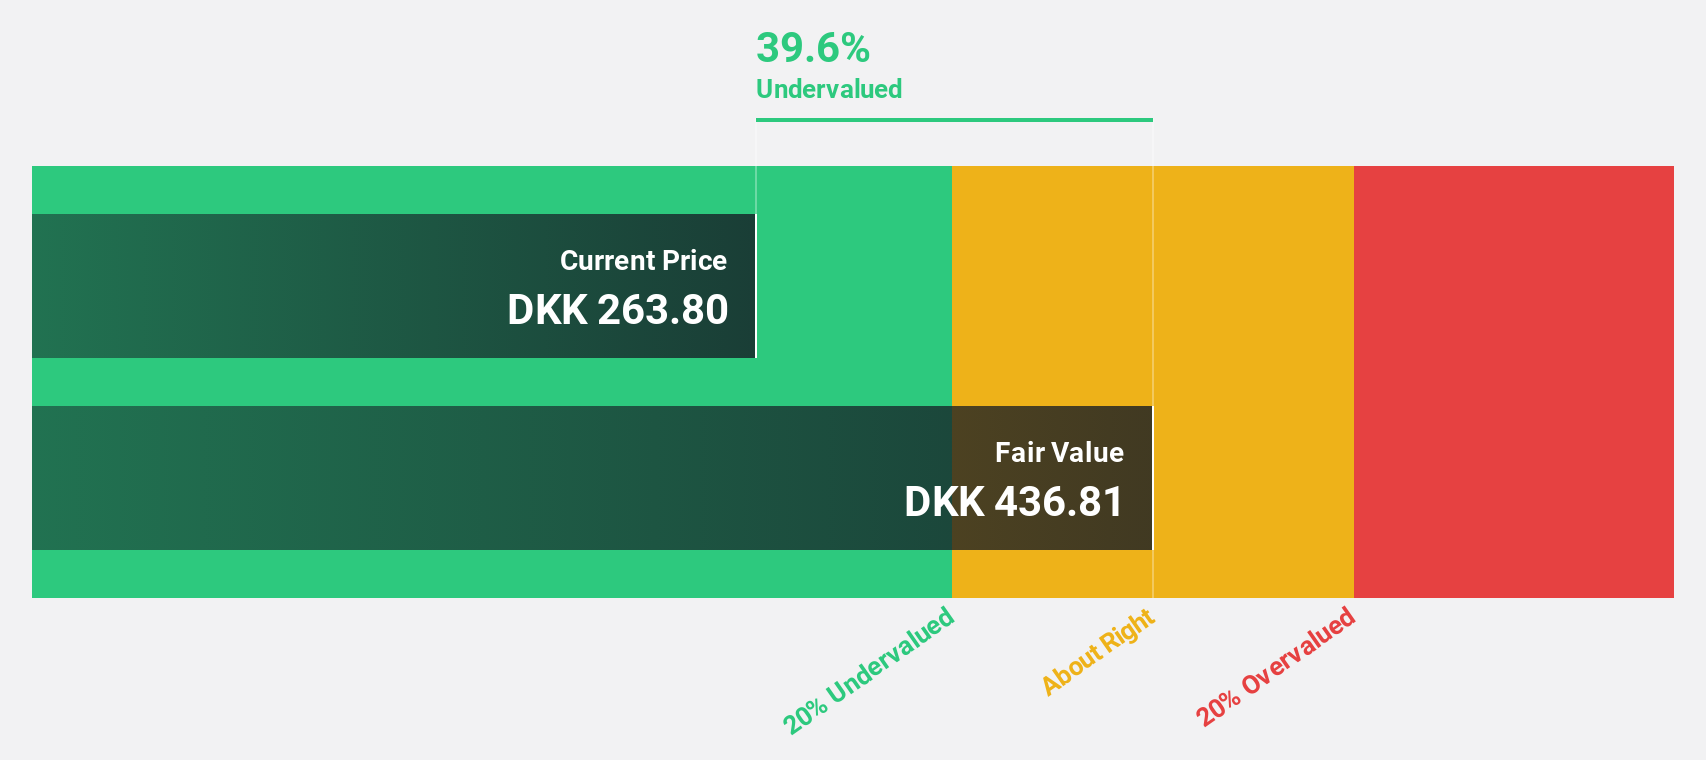
Netcompany Group appears undervalued based on cash flows, trading at DKK320.2, significantly below its estimated future cash flow value of DKK637.29. Despite a decline in profit margins to 3.3% from 7.5% last year, earnings are forecast to grow significantly at 38.1% annually, outpacing the Danish market rate of 7.1%. However, debt coverage by operating cash flow is a concern and large one-off items have impacted financial results recently.
- Upon reviewing our latest growth report, Netcompany Group's projected financial performance appears quite optimistic.
- Unlock comprehensive insights into our analysis of Netcompany Group stock in this financial health report.
TGS (OB:TGS)
Overview: TGS ASA offers geoscience data services to the oil and gas industry both in Norway and internationally, with a market cap of NOK25.94 billion.
Operations: The company generates revenue from its geoscience data services primarily through its Multi-client segment ($872.60 million), Marine Data Acquisition ($768.40 million), and Imaging ($126.70 million).
Estimated Discount To Fair Value: 48.2%
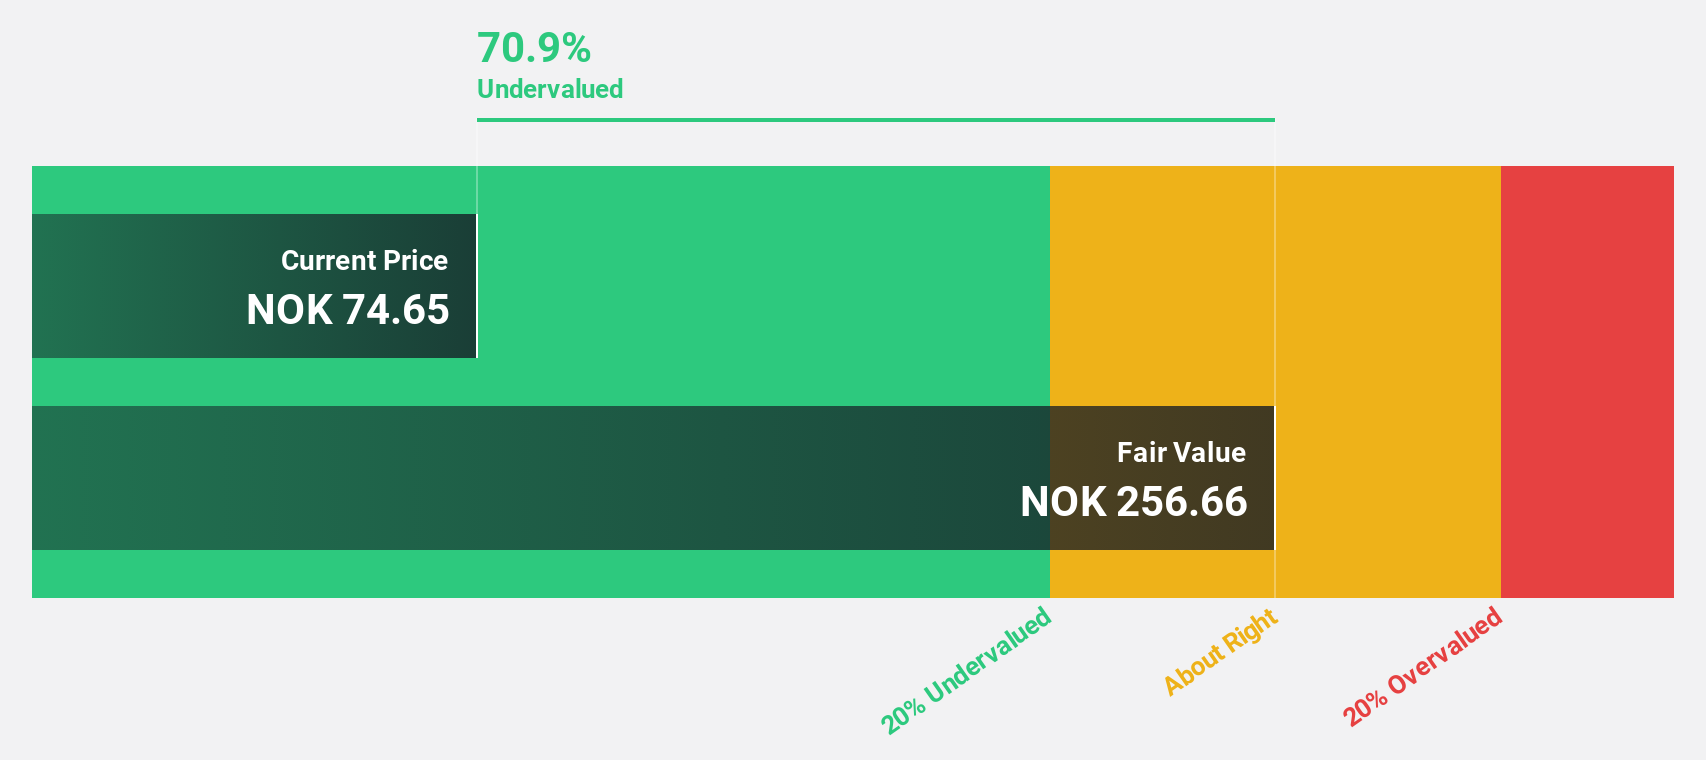
TGS is trading at NOK132, significantly below its estimated future cash flow value of NOK255.07, suggesting it may be undervalued based on cash flows. The company's revenue is forecast to grow faster than the Norwegian market at 8.2% annually. However, the dividend yield of 4.57% is not well covered by earnings, and return on equity is expected to remain low at 10.1%. Recent strategic expansions in seismic surveys and cloud technology could enhance future profitability prospects.
- According our earnings growth report, there's an indication that TGS might be ready to expand.
- Take a closer look at TGS' balance sheet health here in our report.
New Wave Group (OM:NEWA B)
Overview: New Wave Group AB (publ) is involved in designing, acquiring, and developing brands and products across corporate, sports, gifts, and home furnishings sectors globally with a market cap of approximately SEK12.47 billion.
Operations: The company's revenue segments are comprised of Corporate at SEK5.21 billion, Sports & Leisure at SEK4.10 billion, and Gifts & Home Furnishings at SEK857 million.
Estimated Discount To Fair Value: 44.3%
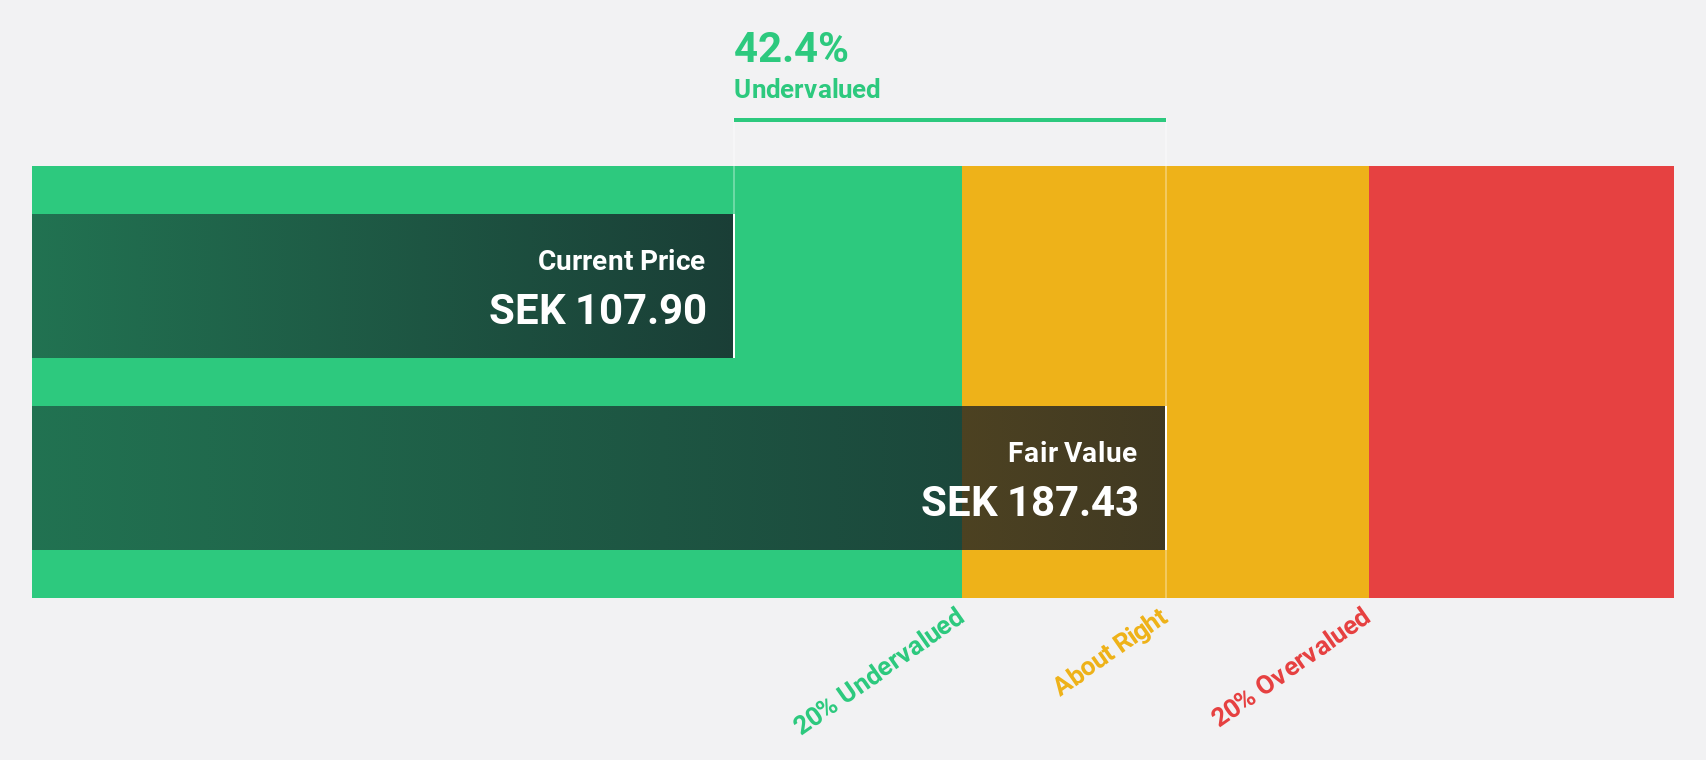
New Wave Group is trading at SEK94, below its estimated future cash flow value of SEK168.84, highlighting potential undervaluation. Earnings are projected to grow 20.4% annually, outpacing the Swedish market's growth rate. However, the dividend yield of 3.19% is not well covered by free cash flows and debt coverage by operating cash flow remains weak. Recent AGM decisions include a reduced dividend and board changes with Lars-Erik Danielsson joining from August 2026.
- Insights from our recent growth report point to a promising forecast for New Wave Group's business outlook.
- Get an in-depth perspective on New Wave Group's balance sheet by reading our health report here.
Where To Now?
- Unlock more gems! Our Undervalued European Stocks Based On Cash Flows screener has unearthed 188 more companies for you to explore.Click here to unveil our expertly curated list of 191 Undervalued European Stocks Based On Cash Flows.
- Are you invested in these stocks already? Keep abreast of every twist and turn by setting up a portfolio with Simply Wall St, where we make it simple for investors like you to stay informed and proactive.
- Enhance your investing ability with the Simply Wall St app and enjoy free access to essential market intelligence spanning every continent.
Want To Explore Some Alternatives?
- Explore high-performing small cap companies that haven't yet garnered significant analyst attention.
- Diversify your portfolio with solid dividend payers offering reliable income streams to weather potential market turbulence.
- Fuel your portfolio with companies showing strong growth potential, backed by optimistic outlooks both from analysts and management.
This article by Simply Wall St is general in nature. We provide commentary based on historical data and analyst forecasts only using an unbiased methodology and our articles are not intended to be financial advice. It does not constitute a recommendation to buy or sell any stock, and does not take account of your objectives, or your financial situation. We aim to bring you long-term focused analysis driven by fundamental data. Note that our analysis may not factor in the latest price-sensitive company announcements or qualitative material. Simply Wall St has no position in any stocks mentioned.
Have feedback on this article? Concerned about the content? Get in touch with us directly. Alternatively, email editorial-team@simplywallst.com