


Will Reaffirmed Payouts Amid Weaker Earnings Change Cheniere Energy Partners' (CQP) Narrative?
- Earlier this month, Cheniere Energy Partners, L.P. reported first-quarter 2026 results showing revenue of US$3.60 billion versus US$2.99 billion a year earlier, while net income fell to US$186 million from US$641 million and earnings per unit eased to US$0.19 from US$1.08.
- The partnership also reaffirmed its full-year 2026 distribution guidance of US$3.10–US$3.40 per common unit, underscoring its intention to maintain a US$3.10 base payout despite weaker quarterly profitability.
- Next, we’ll explore how the reaffirmed US$3.10 base distribution amid lower quarterly earnings shapes Cheniere Energy Partners’ investment narrative.
AI is about to change healthcare. These 32 stocks are working on everything from early diagnostics to drug discovery. The best part - they are all under $10b in market cap - there's still time to get in early.
What Is Cheniere Energy Partners' Investment Narrative?
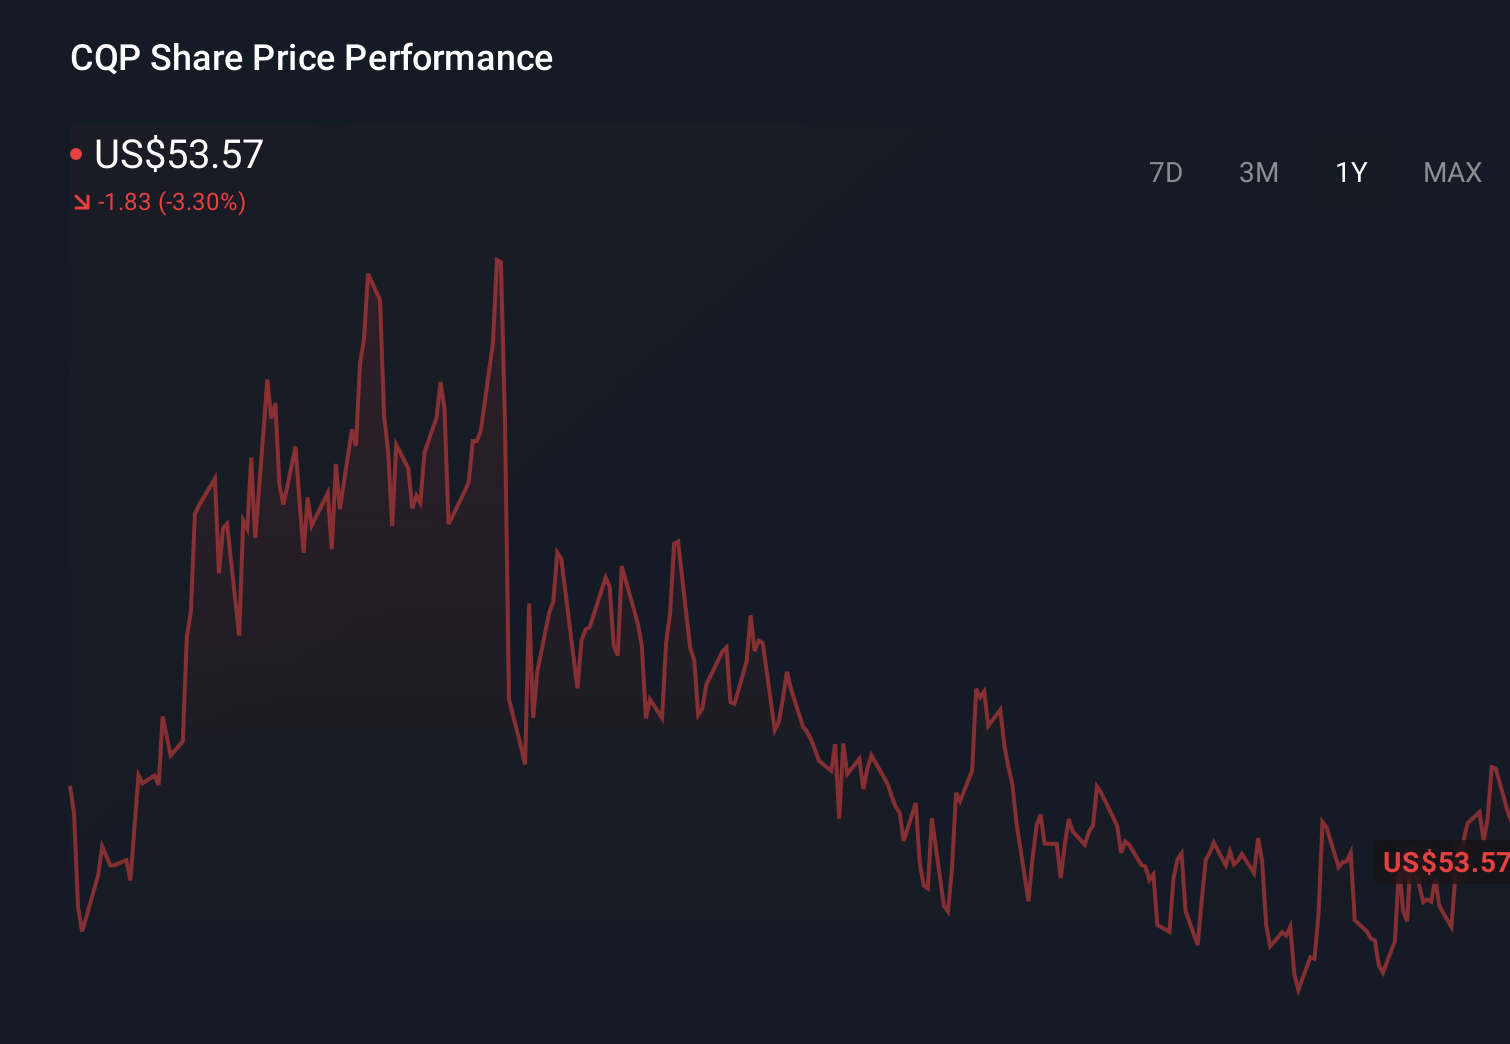
To own Cheniere Energy Partners, you need to be comfortable with a business that prioritizes steady cash distributions over rapid growth, funded by long-term LNG contracts and a sizeable debt load. The reaffirmed US$3.10–US$3.40 per-unit distribution guidance, even after Q1 2026 net income fell sharply, reinforces that income-first story but also sharpens the focus on coverage, refinancing costs and balance sheet resilience. Short term, the key catalysts still center on LNG export demand, contract performance and interest expense, and this quarter’s weaker profitability nudges earnings quality and payout sustainability higher up the risk list rather than changing it entirely. The recent share price gains suggest the market has not treated the Q1 miss as a major shock, but it does reduce the margin for error if operating conditions tighten.
However, investors should be aware that earnings softness and high debt make the payout policy more exposed. Cheniere Energy Partners' shares are on the way up, but could they be overextended? Uncover how much higher they are than fair value.Exploring Other Perspectives
Explore 2 other fair value estimates on Cheniere Energy Partners - why the stock might be worth as much as $59.87!
Reach Your Own Conclusion
Don't just follow the ticker - dig into the data and build a conviction that's truly your own.
- A great starting point for your Cheniere Energy Partners research is our analysis highlighting 2 key rewards and 2 important warning signs that could impact your investment decision.
- Our free Cheniere Energy Partners research report provides a comprehensive fundamental analysis summarized in a single visual - the Snowflake - making it easy to evaluate Cheniere Energy Partners' overall financial health at a glance.
Searching For A Fresh Perspective?
Markets shift fast. These stocks won't stay hidden for long. Get the list while it matters:
- Rare earth metals are the new gold rush. Find out which 30 stocks are leading the charge.
- The future of work is here. Discover the 29 top robotics and automation stocks leading the charge in AI-driven automation and industrial transformation.
- We've uncovered the 12 dividend fortresses yielding 5%+ that don't just survive market storms, but thrive in them.
This article by Simply Wall St is general in nature. We provide commentary based on historical data and analyst forecasts only using an unbiased methodology and our articles are not intended to be financial advice. It does not constitute a recommendation to buy or sell any stock, and does not take account of your objectives, or your financial situation. We aim to bring you long-term focused analysis driven by fundamental data. Note that our analysis may not factor in the latest price-sensitive company announcements or qualitative material. Simply Wall St has no position in any stocks mentioned.
Have feedback on this article? Concerned about the content? Get in touch with us directly. Alternatively, email editorial-team@simplywallst.com