


Is Newmark Group (NMRK) Still Attractive After Recent Share Price Pullback?
- If you are wondering whether Newmark Group's current share price still offers value, you are not alone. This article breaks down what the numbers are really saying about the stock.
- The share price closed at US$14.26 recently, with returns of 0.5% over 7 days, a 6.6% decline over 30 days, a 16.0% decline year to date, a 15.7% gain over 1 year, 127.9% over 3 years and 42.0% over 5 years. Together, these figures give you a mixed picture of recent momentum.
- That mix of short term weakness and longer term strength has put more attention on what is driving Newmark Group's valuation and whether the recent pullback changes the balance of risk and opportunity. Recent coverage has focused on how the business is positioned in real estate services and how investors are reacting to those fundamentals.
- On Simply Wall St's 6 point valuation framework, Newmark Group scores 5 out of 6. The rest of this article walks through the key valuation checks, before finishing with a way to look at value that goes beyond any single model.
Approach 1: Newmark Group Discounted Cash Flow (DCF) Analysis
A Discounted Cash Flow, or DCF, model looks at the cash Newmark Group is expected to generate in the future, then discounts those projected cash flows back to today to estimate what the business could be worth right now.
For Newmark Group, the model used is a 2 Stage Free Cash Flow to Equity approach based on cash flow projections. The latest twelve month free cash flow is about $126 million. Simply Wall St uses analyst inputs where available, then extends them further out. In this case, free cash flow is projected to reach $489 million by 2030, with interim estimates such as $338 million in 2026 and $377 million in 2027, all in $ terms.
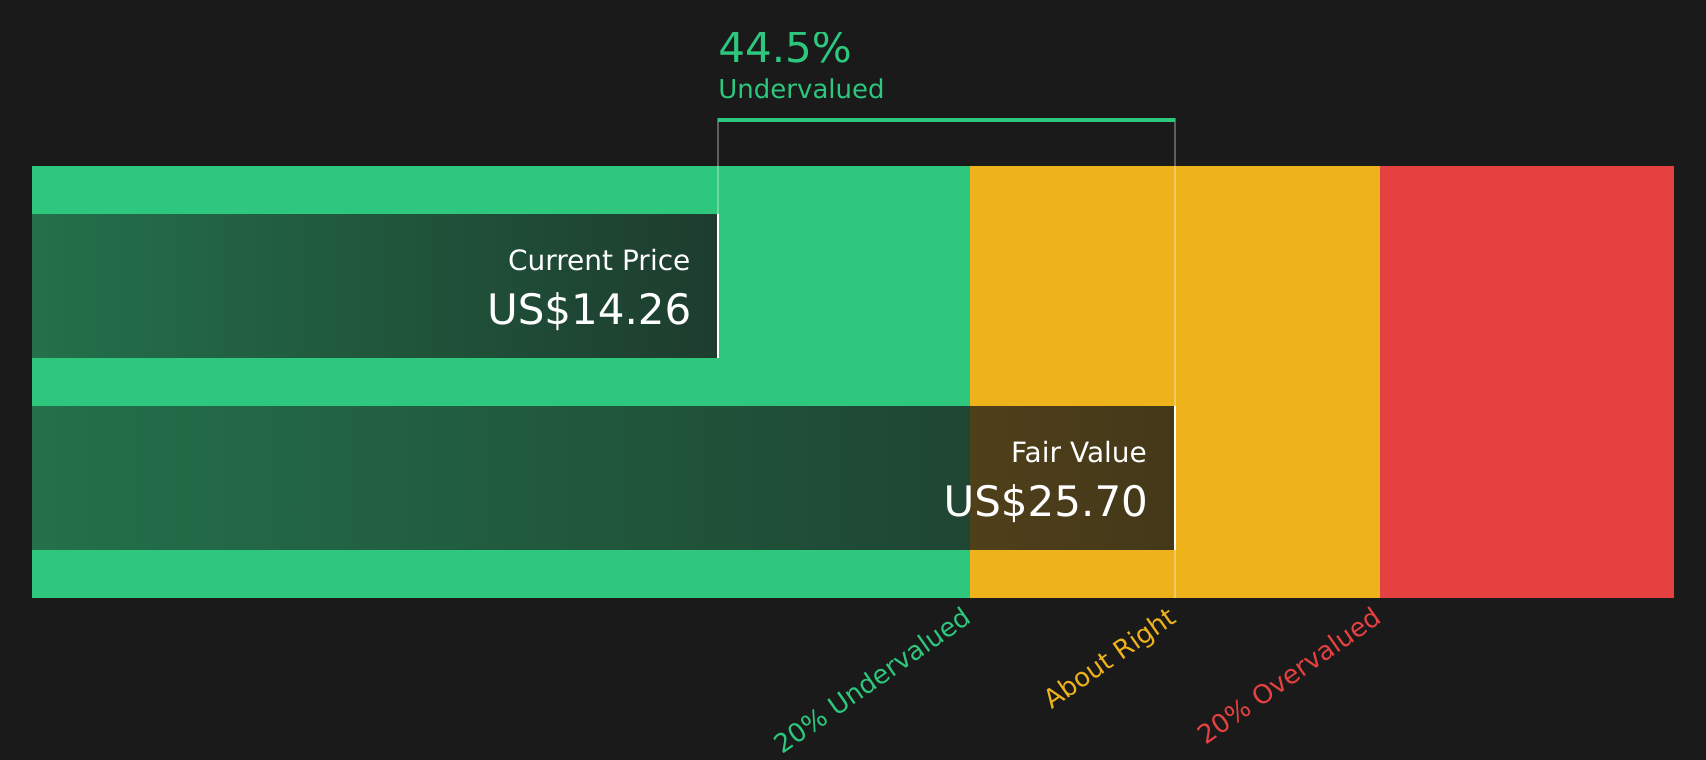
After discounting these future cash flows, the model arrives at an estimated intrinsic value of about $25.71 per share. Compared with the recent share price of US$14.26, this suggests the stock is 44.5% undervalued based on this specific set of assumptions.
Result: UNDERVALUED
Our Discounted Cash Flow (DCF) analysis suggests Newmark Group is undervalued by 44.5%. Track this in your watchlist or portfolio, or discover 52 more high quality undervalued stocks.
Approach 2: Newmark Group Price vs Earnings
For a profitable company, the P/E ratio is a useful gauge because it links what you pay for the stock to the earnings it is currently generating. In general, higher growth expectations and lower perceived risk tend to support a higher P/E, while slower growth or higher risk usually point to a lower, more conservative P/E range.
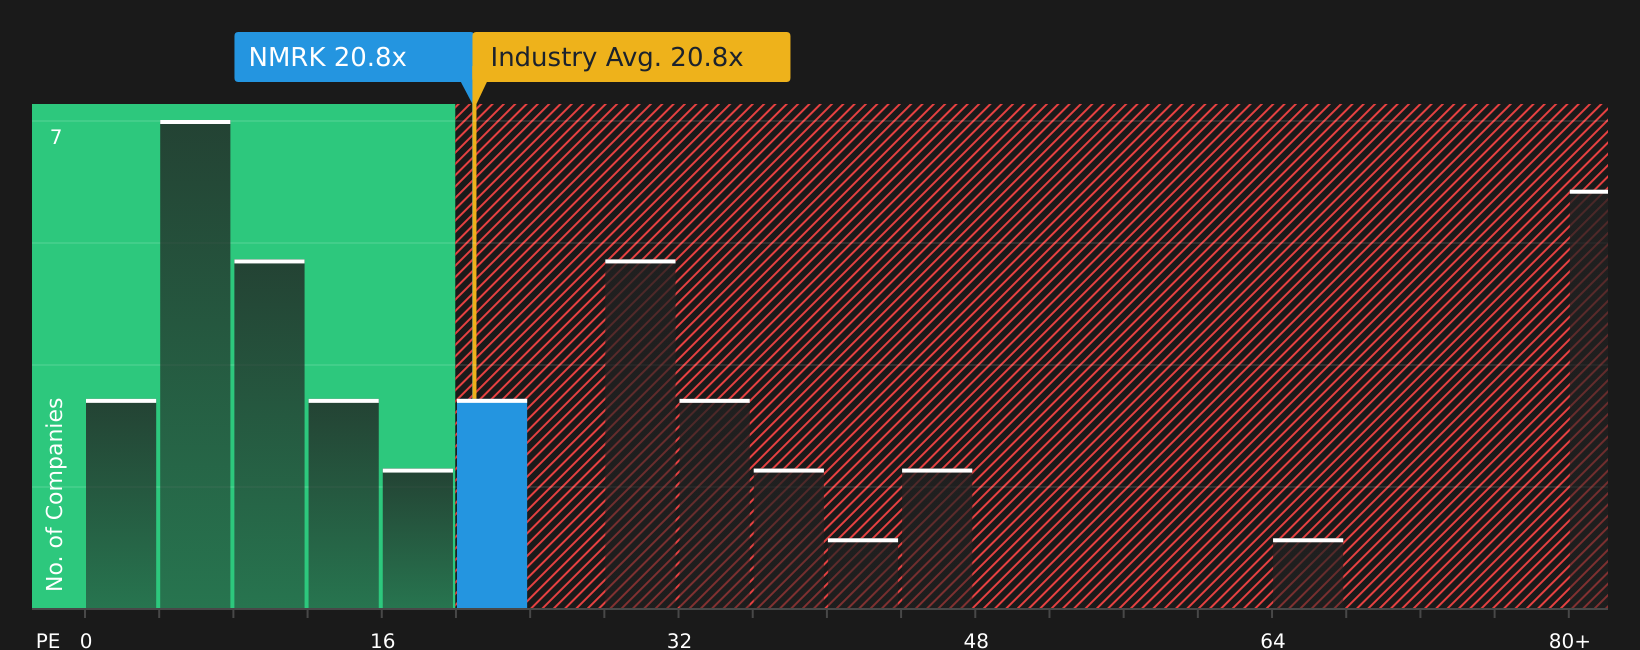
Newmark Group trades on a P/E of 20.84x. That sits close to the Real Estate industry average P/E of 20.78x and below the peer group average of 31.09x. Simply Wall St also calculates a “Fair Ratio” of 21.54x, which reflects the P/E that might be expected given factors such as Newmark Group’s earnings profile, its industry, profit margin, market capitalization and key risks.
This Fair Ratio is more tailored than a simple comparison with peers or the broad industry because it brings growth, risk and profitability into a single yardstick rather than relying only on where other companies currently trade. Compared with the actual P/E of 20.84x, the Fair Ratio of 21.54x indicates the stock is slightly cheaper than this customised benchmark.
Result: UNDERVALUED
P/E ratios tell one story, but what if the real opportunity lies elsewhere? Start investing in legacies, not executives. Discover our 20 top founder-led companies.
Upgrade Your Decision Making: Choose your Newmark Group Narrative
Earlier it was mentioned that there is an even better way to understand valuation. Think of a Narrative as your own clear story for Newmark Group that connects what you believe about its future revenue, earnings and margins to a specific fair value estimate. Then compare that fair value to the current share price, all within an easy tool on Simply Wall St’s Community page that updates automatically when fresh news or earnings arrive. One investor might build a bullish Newmark Group Narrative around a higher fair value such as US$22.25, stronger revenue assumptions and a higher future P/E. Another might build a more cautious Narrative anchored closer to US$14.00 with more conservative estimates. Seeing those side by side can help you decide whether today’s price looks high, low or broadly in line with your own expectations.
Do you think there's more to the story for Newmark Group? Head over to our Community to see what others are saying!

This article by Simply Wall St is general in nature. We provide commentary based on historical data and analyst forecasts only using an unbiased methodology and our articles are not intended to be financial advice. It does not constitute a recommendation to buy or sell any stock, and does not take account of your objectives, or your financial situation. We aim to bring you long-term focused analysis driven by fundamental data. Note that our analysis may not factor in the latest price-sensitive company announcements or qualitative material. Simply Wall St has no position in any stocks mentioned.
Have feedback on this article? Concerned about the content? Get in touch with us directly. Alternatively, email editorial-team@simplywallst.com