
 Nasdaq
 華爾街日報
華爾街日報Indian Metals and Ferro Alloys Limited's (NSE:IMFA) CEO Subhrakant Panda is the most upbeat insider, and their holdings increased by 9.1% last week
Key Insights
- Indian Metals and Ferro Alloys' significant insider ownership suggests inherent interests in company's expansion
- 54% of the company is held by a single shareholder (Subhrakant Panda)
- Ownership research, combined with past performance data can help provide a good understanding of opportunities in a stock
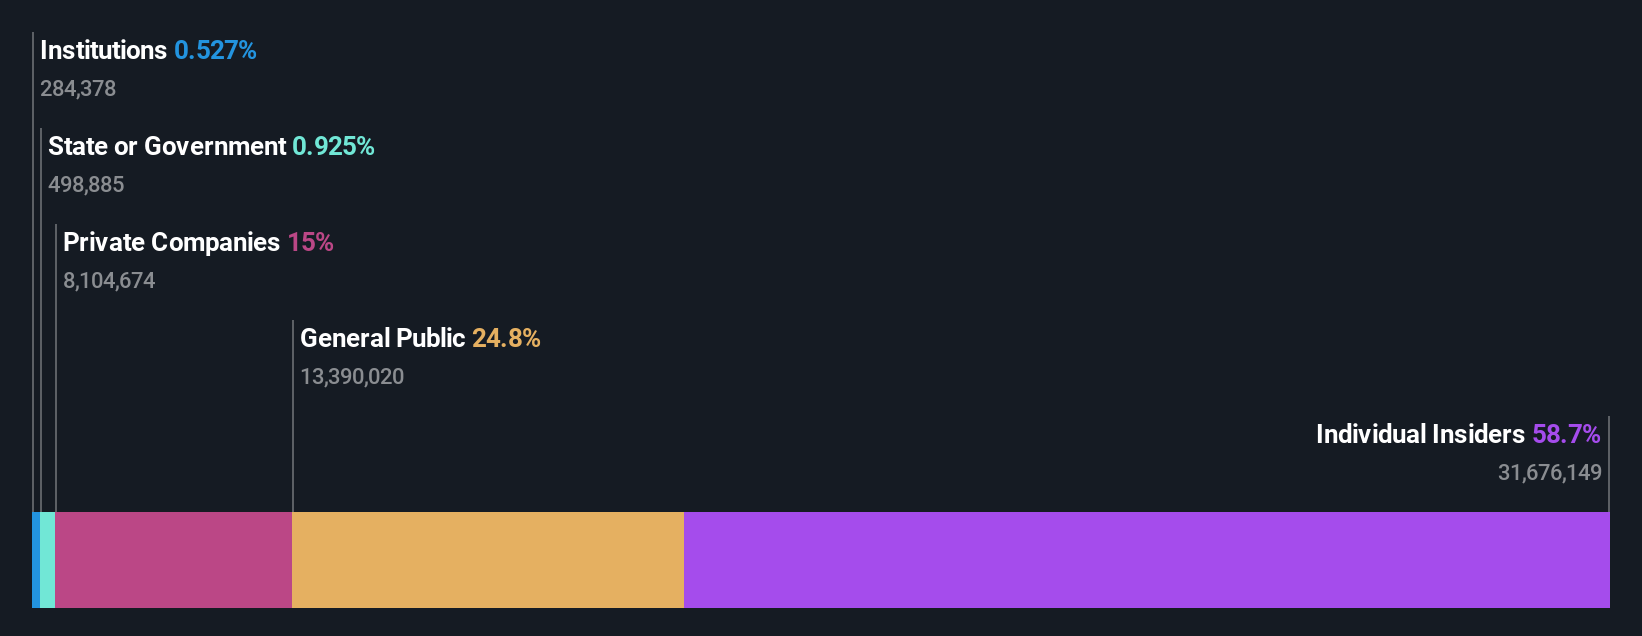
If you want to know who really controls Indian Metals and Ferro Alloys Limited (NSE:IMFA), then you'll have to look at the makeup of its share registry. With 59% stake, individual insiders possess the maximum shares in the company. Put another way, the group faces the maximum upside potential (or downside risk).
As a result, insiders scored the highest last week as the company hit ₹78b market cap following a 9.1% gain in the stock.
Let's delve deeper into each type of owner of Indian Metals and Ferro Alloys, beginning with the chart below.
View our latest analysis for Indian Metals and Ferro Alloys
What Does The Lack Of Institutional Ownership Tell Us About Indian Metals and Ferro Alloys?
We don't tend to see institutional investors holding stock of companies that are very risky, thinly traded, or very small. Though we do sometimes see large companies without institutions on the register, it's not particularly common.
There are many reasons why a company might not have any institutions on the share registry. It may be hard for institutions to buy large amounts of shares, if liquidity (the amount of shares traded each day) is low. If the company has not needed to raise capital, institutions might lack the opportunity to build a position. On the other hand, it's always possible that professional investors are avoiding a company because they don't think it's the best place for their money. Institutional investors may not find the historic growth of the business impressive, or there might be other factors at play. You can see the past revenue performance of Indian Metals and Ferro Alloys, for yourself, below.

Indian Metals and Ferro Alloys is not owned by hedge funds. The company's CEO Subhrakant Panda is the largest shareholder with 54% of shares outstanding. This essentially means that they have significant control over the outcome or future of the company, which is why insider ownership is usually looked upon favourably by prospective buyers. Meanwhile, the second and third largest shareholders, hold 13% and 2.3%, of the shares outstanding, respectively.
While it makes sense to study institutional ownership data for a company, it also makes sense to study analyst sentiments to know which way the wind is blowing. There is a little analyst coverage of the stock, but not much. So there is room for it to gain more coverage.
Insider Ownership Of Indian Metals and Ferro Alloys
While the precise definition of an insider can be subjective, almost everyone considers board members to be insiders. The company management answer to the board and the latter should represent the interests of shareholders. Notably, sometimes top-level managers are on the board themselves.
Most consider insider ownership a positive because it can indicate the board is well aligned with other shareholders. However, on some occasions too much power is concentrated within this group.
Our information suggests that insiders own more than half of Indian Metals and Ferro Alloys Limited. This gives them effective control of the company. That means they own ₹46b worth of shares in the ₹78b company. That's quite meaningful. It is good to see this level of investment. You can check here to see if those insiders have been buying recently.
General Public Ownership
The general public-- including retail investors -- own 25% stake in the company, and hence can't easily be ignored. This size of ownership, while considerable, may not be enough to change company policy if the decision is not in sync with other large shareholders.
Private Company Ownership
We can see that Private Companies own 15%, of the shares on issue. It might be worth looking deeper into this. If related parties, such as insiders, have an interest in one of these private companies, that should be disclosed in the annual report. Private companies may also have a strategic interest in the company.
Next Steps:
It's always worth thinking about the different groups who own shares in a company. But to understand Indian Metals and Ferro Alloys better, we need to consider many other factors. For example, we've discovered 2 warning signs for Indian Metals and Ferro Alloys that you should be aware of before investing here.
If you would prefer discover what analysts are predicting in terms of future growth, do not miss this free report on analyst forecasts.
NB: Figures in this article are calculated using data from the last twelve months, which refer to the 12-month period ending on the last date of the month the financial statement is dated. This may not be consistent with full year annual report figures.
Have feedback on this article? Concerned about the content? Get in touch with us directly. Alternatively, email editorial-team (at) simplywallst.com.
This article by Simply Wall St is general in nature. We provide commentary based on historical data and analyst forecasts only using an unbiased methodology and our articles are not intended to be financial advice. It does not constitute a recommendation to buy or sell any stock, and does not take account of your objectives, or your financial situation. We aim to bring you long-term focused analysis driven by fundamental data. Note that our analysis may not factor in the latest price-sensitive company announcements or qualitative material. Simply Wall St has no position in any stocks mentioned.