
 Nasdaq
 華爾街日報
華爾街日報Is Coterra Energy (CTRA) Pricing Reflect Its DCF And P/E Valuation Gap Today
- If you are wondering whether Coterra Energy's current share price lines up with its underlying worth, you are not alone. This article focuses squarely on what the numbers suggest about value.
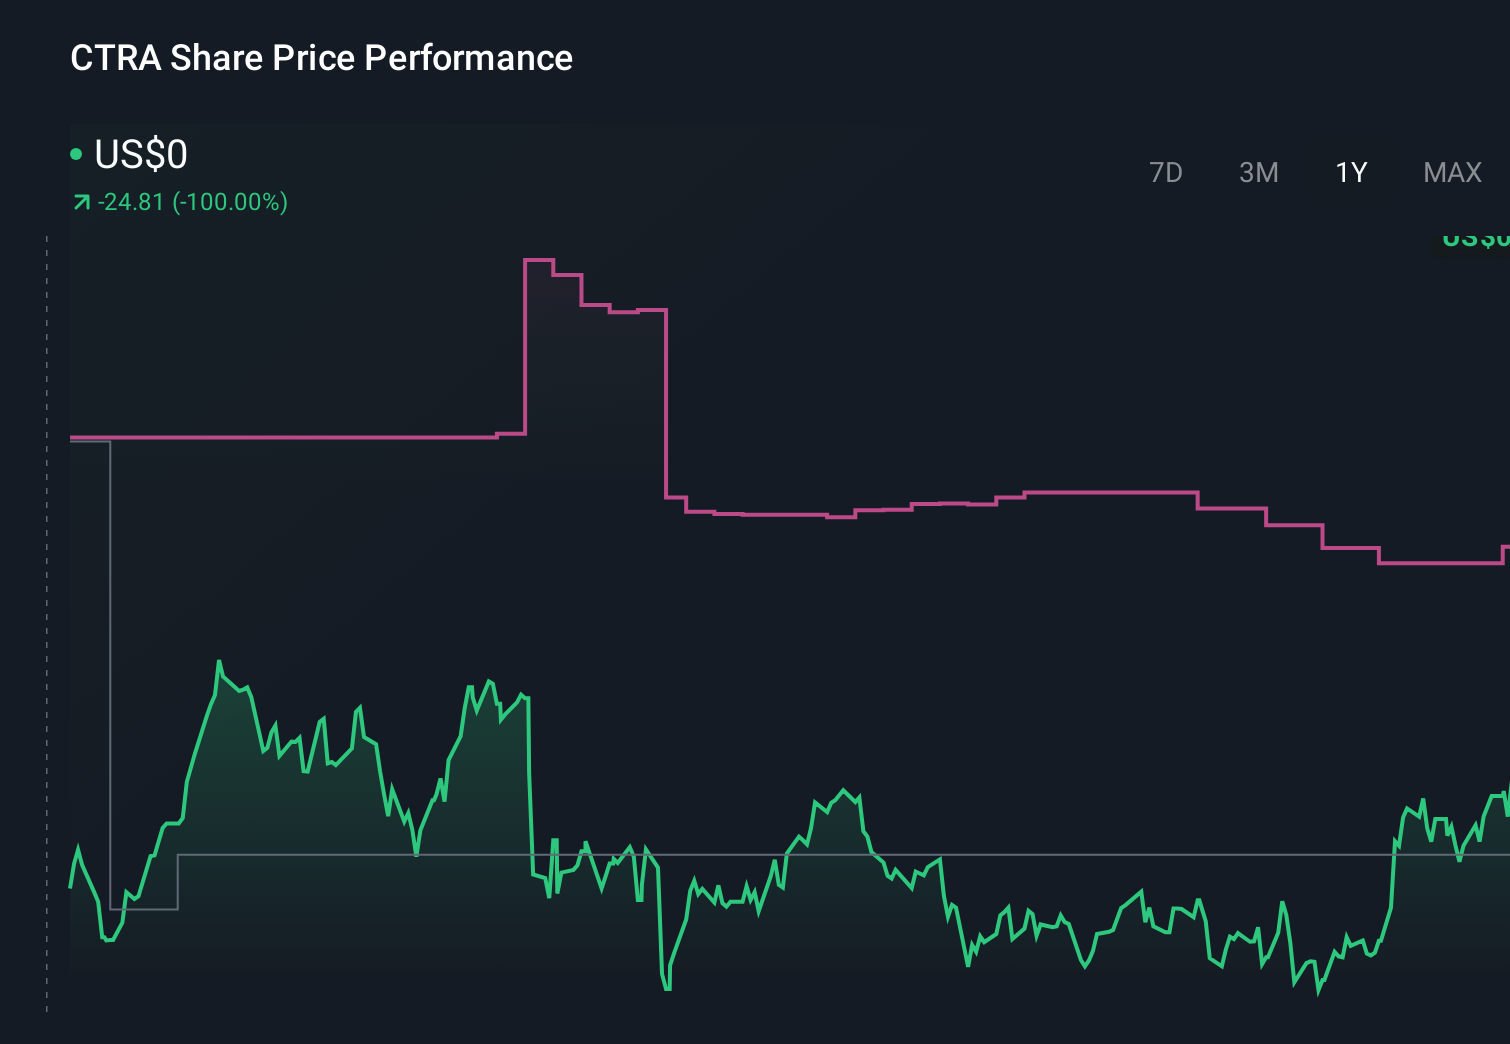
- Coterra's recent share performance has been mixed, with a 3.6% gain over the last 7 days, a 0.8% decline over 30 days, and a year-to-date return of a 3.3% decline, on top of a 9.7% decline over the last year, set against longer term returns of 12.3% over 3 years and 78.7% over 5 years.
- Investors have been watching Coterra as it continues to trade around recent levels, with market attention shaped by broader sentiment toward energy stocks and company specific updates such as capital allocation decisions, asset development plans, and any portfolio changes. These factors often frame how traders interpret short term moves, even when the focus is really on long term cash flows and asset quality.
- On Simply Wall St's valuation checks, Coterra Energy scores a 6 out of 6. Next we will compare different valuation approaches to see what might be driving that result, before finishing with a way of thinking about value that goes beyond any single model.
Find out why Coterra Energy's -9.7% return over the last year is lagging behind its peers.
Approach 1: Coterra Energy Discounted Cash Flow (DCF) Analysis
A Discounted Cash Flow model takes the cash Coterra Energy is expected to generate in the future and discounts those cash flows back to today to estimate what the business might be worth now.
Coterra’s latest twelve month free cash flow is about $1.4b. Simply Wall St uses a 2 Stage Free Cash Flow to Equity model that combines analyst forecasts with its own extrapolations. For example, projected free cash flow for 2026 is $2.38b and for 2030 it is $3.17b, both expressed in today’s dollar terms after discounting. The ten year projection path runs between roughly $2.38b and $3.45b of annual free cash flow before discounting, with later years based on modelled growth rates rather than direct analyst estimates.
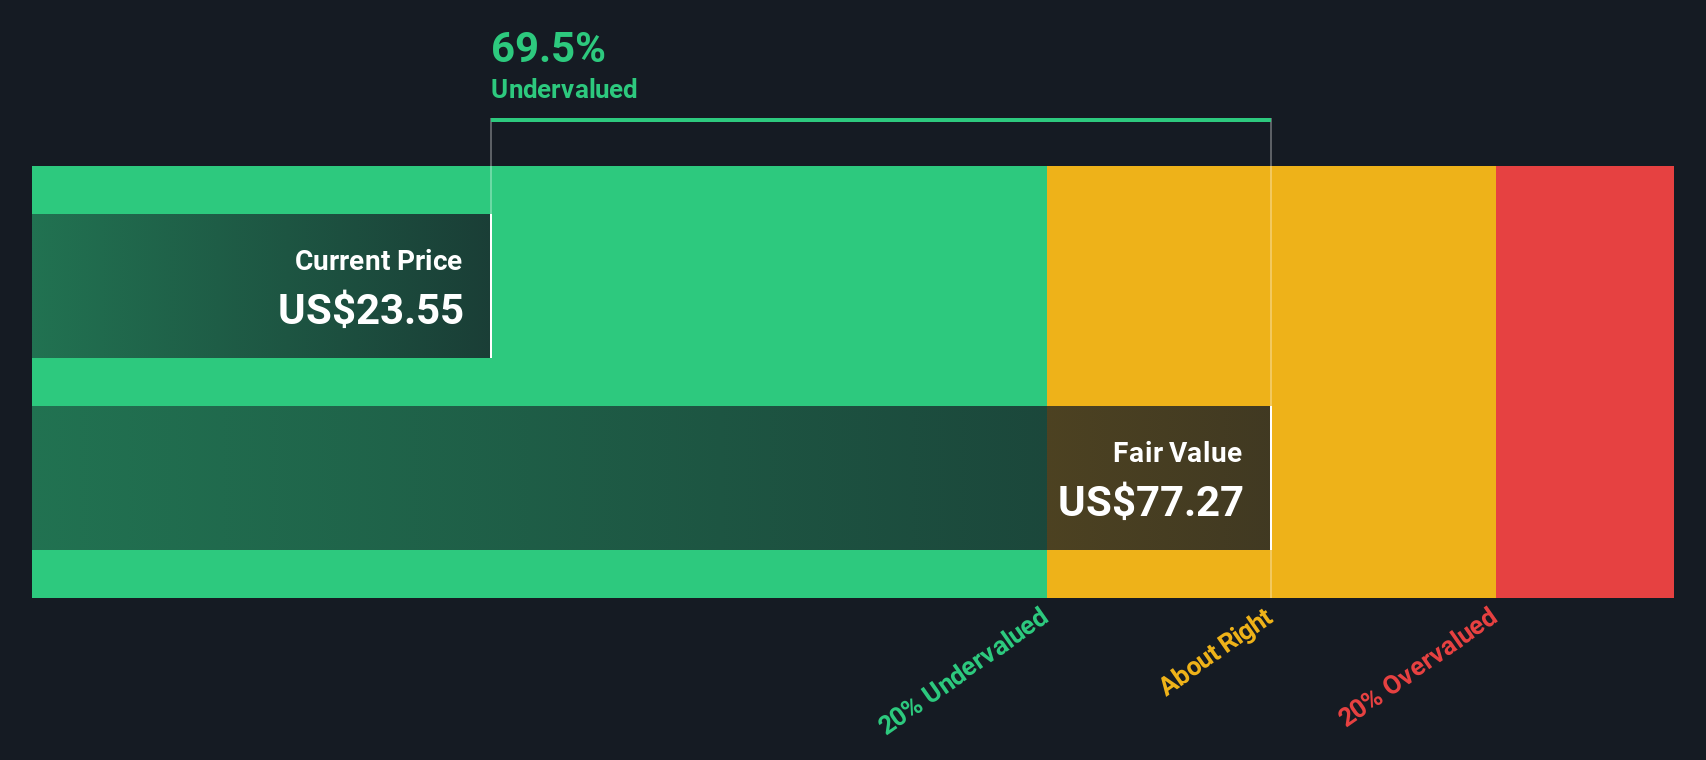
Bringing all those projected cash flows back to today, the model arrives at an estimated intrinsic value of $93.01 per share. Compared to the current share price, this implies a 72.4% discount, which indicates Coterra is trading well below this particular estimate of underlying value.
Result: UNDERVALUED
Our Discounted Cash Flow (DCF) analysis suggests Coterra Energy is undervalued by 72.4%. Track this in your watchlist or portfolio, or discover 871 more undervalued stocks based on cash flows.
Approach 2: Coterra Energy Price vs Earnings
For a profitable company like Coterra Energy, the P/E ratio is a useful shorthand for what the market is paying for each dollar of earnings, which ties directly to the cash flows that ultimately matter to shareholders.
What counts as a "normal" P/E partly reflects how the market views a company’s growth prospects and risk profile. Higher growth and lower perceived risk often support a higher multiple, while slower growth or higher uncertainty usually point to a lower one.
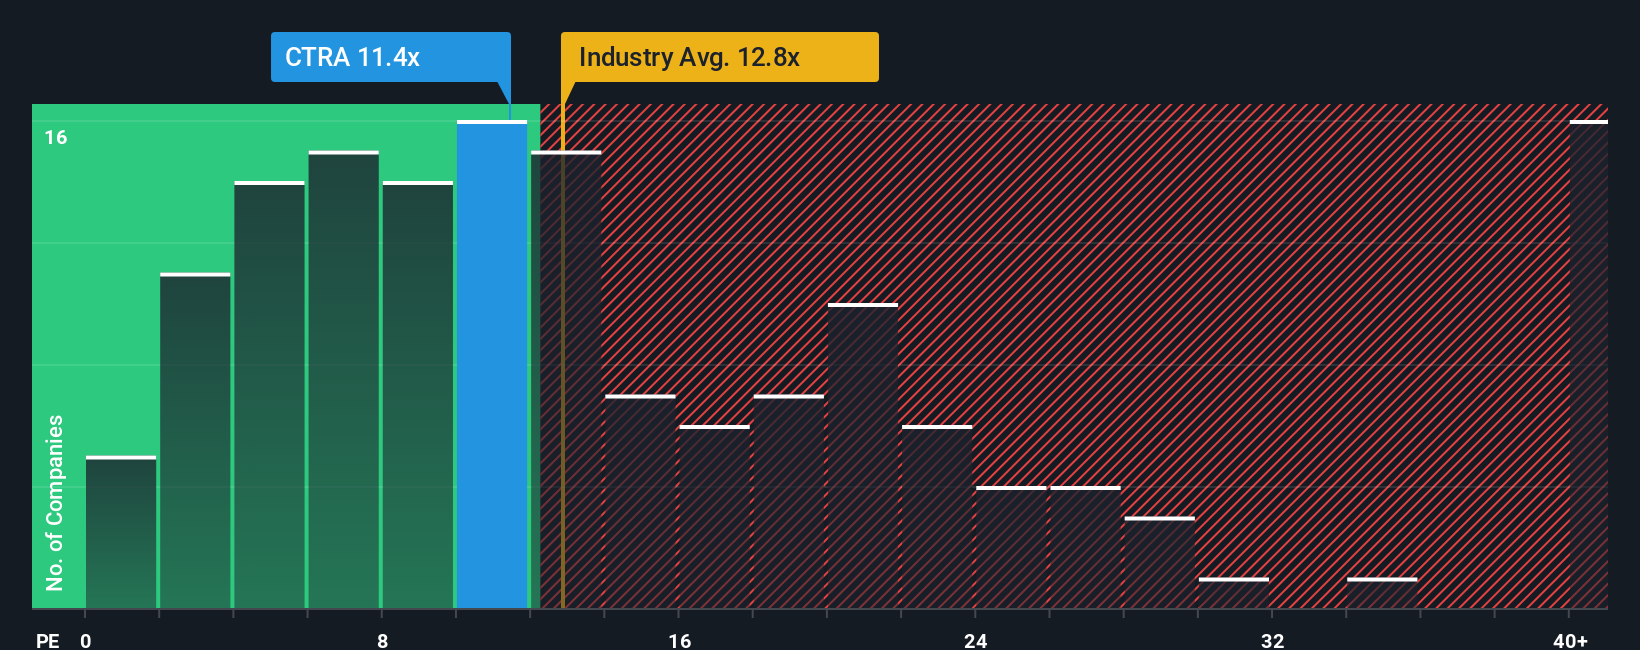
Coterra currently trades on a P/E of 11.89x. That sits below the Oil and Gas industry average of about 13.71x and well below the peer group average of 31.80x. Simply Wall St also estimates a proprietary “Fair Ratio” for Coterra of 18.78x, which reflects factors such as earnings growth, industry, profit margins, market cap and specific risks.
This Fair Ratio is designed to be more tailored than a simple industry or peer comparison because it looks at Coterra’s own characteristics rather than assuming that all companies in the sector deserve the same multiple.
Comparing the Fair Ratio of 18.78x with the current P/E of 11.89x suggests the shares are trading below this model based assessment of a reasonable earnings multiple.
Result: UNDERVALUED
P/E ratios tell one story, but what if the real opportunity lies elsewhere? Discover 1442 companies where insiders are betting big on explosive growth.
Upgrade Your Decision Making: Choose your Coterra Energy Narrative
Earlier we mentioned that there is an even better way to understand valuation, so let us introduce you to Narratives. Narratives let you attach your own story about Coterra Energy to numbers like fair value, future revenue, earnings and margins, then link that story to a concrete valuation that you can compare with the current share price.
On Simply Wall St’s Community page, Narratives are an easy tool used by millions of investors. You set your assumptions, see how they translate into a forecast and a fair value, and then quickly check whether that fair value sits above or below the current price to help you decide if Coterra looks interesting, too expensive or somewhere in between.
Narratives also update when new information arrives, such as Coterra’s earnings, production news or changes to analyst price targets. Your fair value view adjusts with the story instead of staying frozen in time.
For example, one Coterra Narrative might lean closer to the higher analyst target of US$40.00 if the author expects stronger earnings. Another might anchor near the lower US$27.00 target if the author is more cautious, and seeing those side by side helps you judge where your own view fits on that spectrum.
Do you think there's more to the story for Coterra Energy? Head over to our Community to see what others are saying!
This article by Simply Wall St is general in nature. We provide commentary based on historical data and analyst forecasts only using an unbiased methodology and our articles are not intended to be financial advice. It does not constitute a recommendation to buy or sell any stock, and does not take account of your objectives, or your financial situation. We aim to bring you long-term focused analysis driven by fundamental data. Note that our analysis may not factor in the latest price-sensitive company announcements or qualitative material. Simply Wall St has no position in any stocks mentioned.
Have feedback on this article? Concerned about the content? Get in touch with us directly. Alternatively, email editorial-team@simplywallst.com