
 Nasdaq
 華爾街日報
華爾街日報Is Danone (ENXTPA:BN) Pricing Reflect Its Cash Flows And Evolving Consumer Trends
- If you are looking at Danone and wondering whether the current share price really lines up with the underlying business, this article is designed to walk you through that question in a clear, practical way.
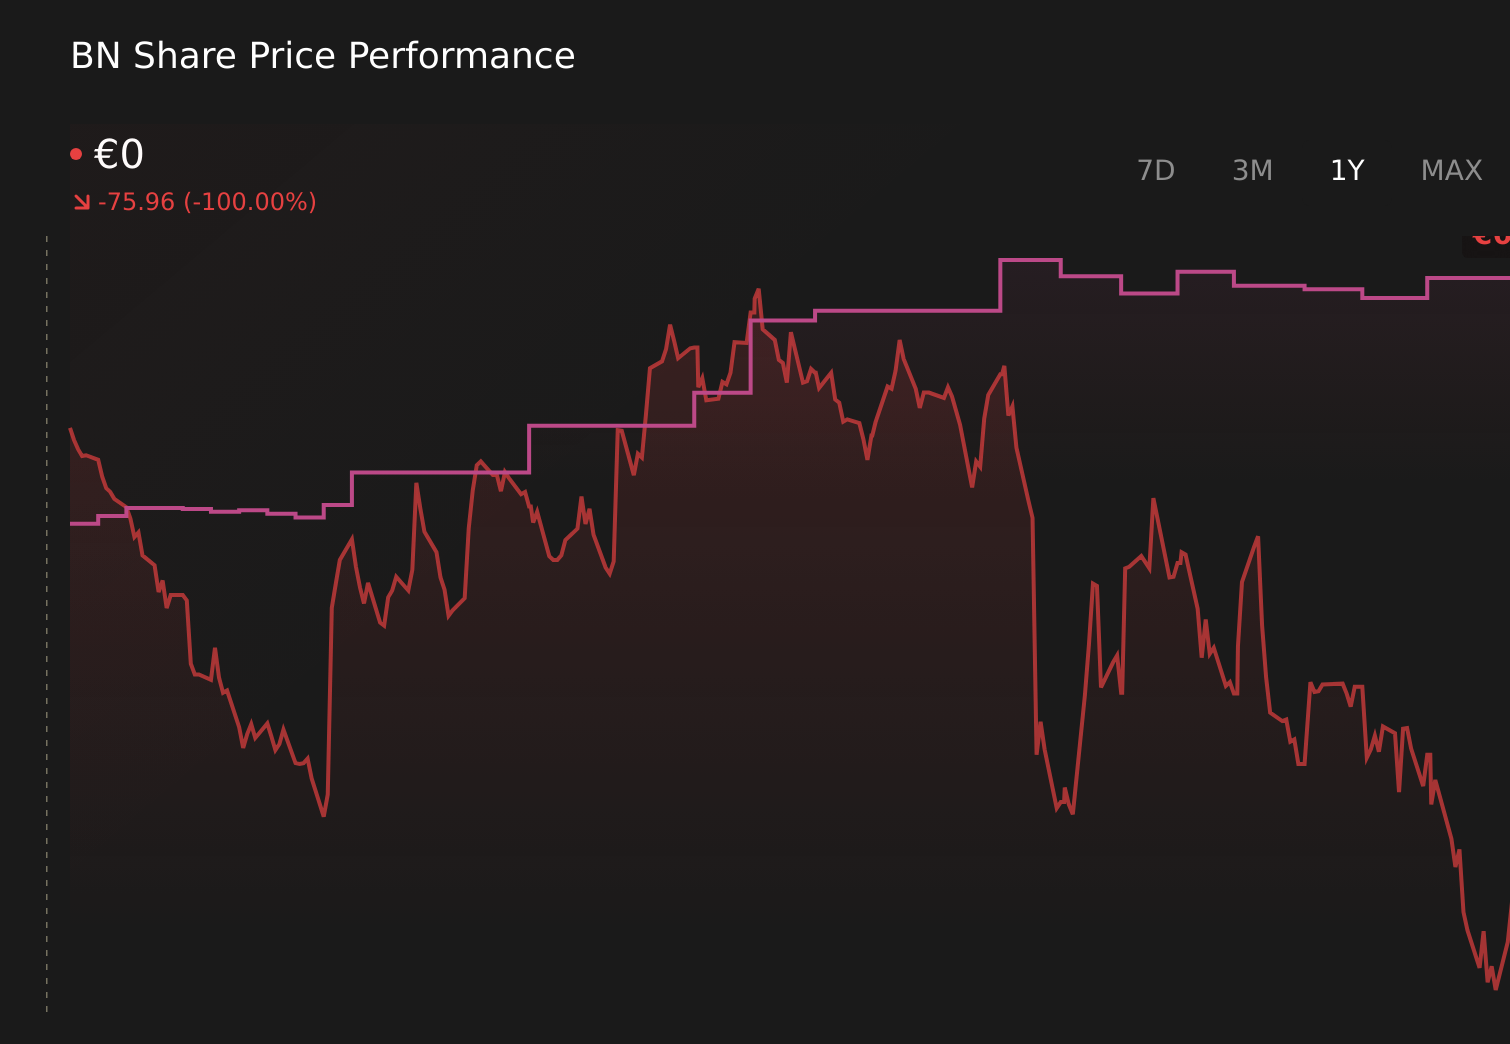
- Danone shares most recently closed at €75.44, with returns of a 1.8% decline over 7 days, a 3.6% decline over 30 days, a 0.8% decline year to date and a 19.4% gain over 1 year, 65.2% over 3 years and 63.3% over 5 years, which gives useful context before thinking about what the stock might be worth.
- Recent news coverage around Danone has focused on its positioning in the global food and beverage sector and how it is responding to evolving consumer preferences and cost pressures. This kind of context helps explain why the market has periodically reassessed the stock, contributing to the pattern of returns you see today.
- Our valuation checks give Danone a score of 2 out of 6. This suggests some signals of potential undervaluation but also areas where the pricing looks less compelling. Next, we will look at how different valuation methods assess that, before finishing with a framework that can help you think about value in an even more rounded way.
Danone scores just 2/6 on our valuation checks. See what other red flags we found in the full valuation breakdown.
Approach 1: Danone Discounted Cash Flow (DCF) Analysis
A Discounted Cash Flow, or DCF, model takes the cash Danone is expected to generate in the future and discounts those amounts back to today, to estimate what the whole business could be worth in € right now.
For Danone, the model uses a 2 Stage Free Cash Flow to Equity approach based on cash flow projections. The latest twelve month free cash flow is about €2.96b. Analysts provide detailed estimates for the next few years, and beyond that Simply Wall St extrapolates the trend to build out a longer path of expected cash flows.
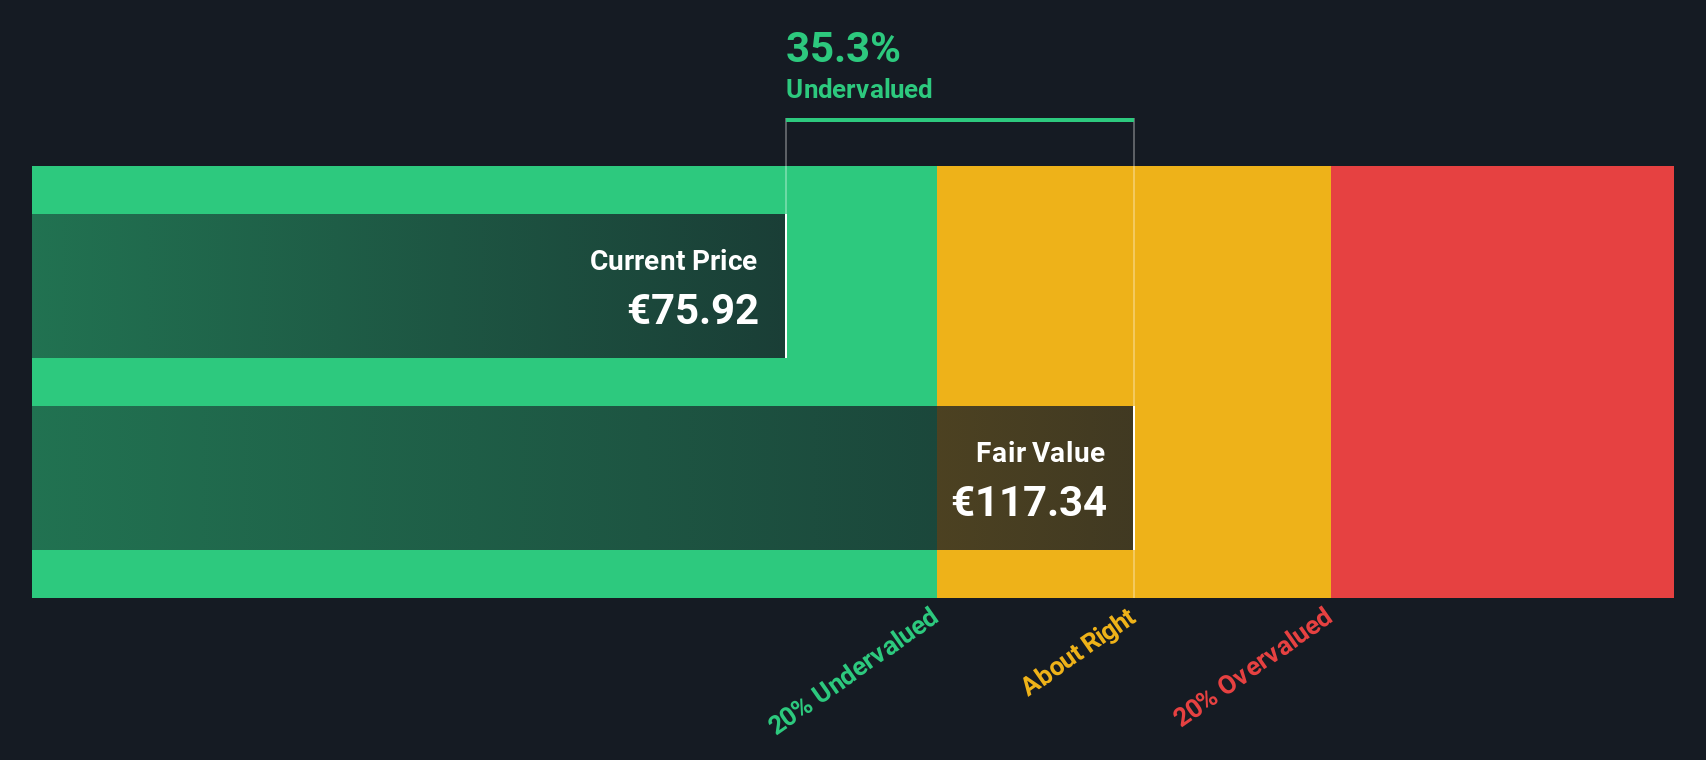
On this basis, projected free cash flow for 2030 is €3.57b, with a full ten year path of forecasts and extrapolated figures feeding into the DCF calculation. When these future cash flows are discounted back and divided by the number of shares, the model arrives at an estimated intrinsic value of about €131.78 per share.
Compared with the recent share price of €75.44, this implies the stock screens as materially undervalued, with an intrinsic discount of around 42.8%.
Result: UNDERVALUED
Our Discounted Cash Flow (DCF) analysis suggests Danone is undervalued by 42.8%. Track this in your watchlist or portfolio, or discover 871 more undervalued stocks based on cash flows.
Approach 2: Danone Price vs Earnings
For a profitable company like Danone, the P/E ratio is a useful way to check what you are paying for each euro of earnings, because it connects the share price directly to the bottom line that ultimately supports shareholder returns.
A higher or lower P/E ratio often reflects what the market is expecting for future growth and how risky those earnings are perceived to be. In very simple terms, stronger growth and lower perceived risk can justify a higher “normal” P/E, while slower growth or higher risk usually point to a lower one.
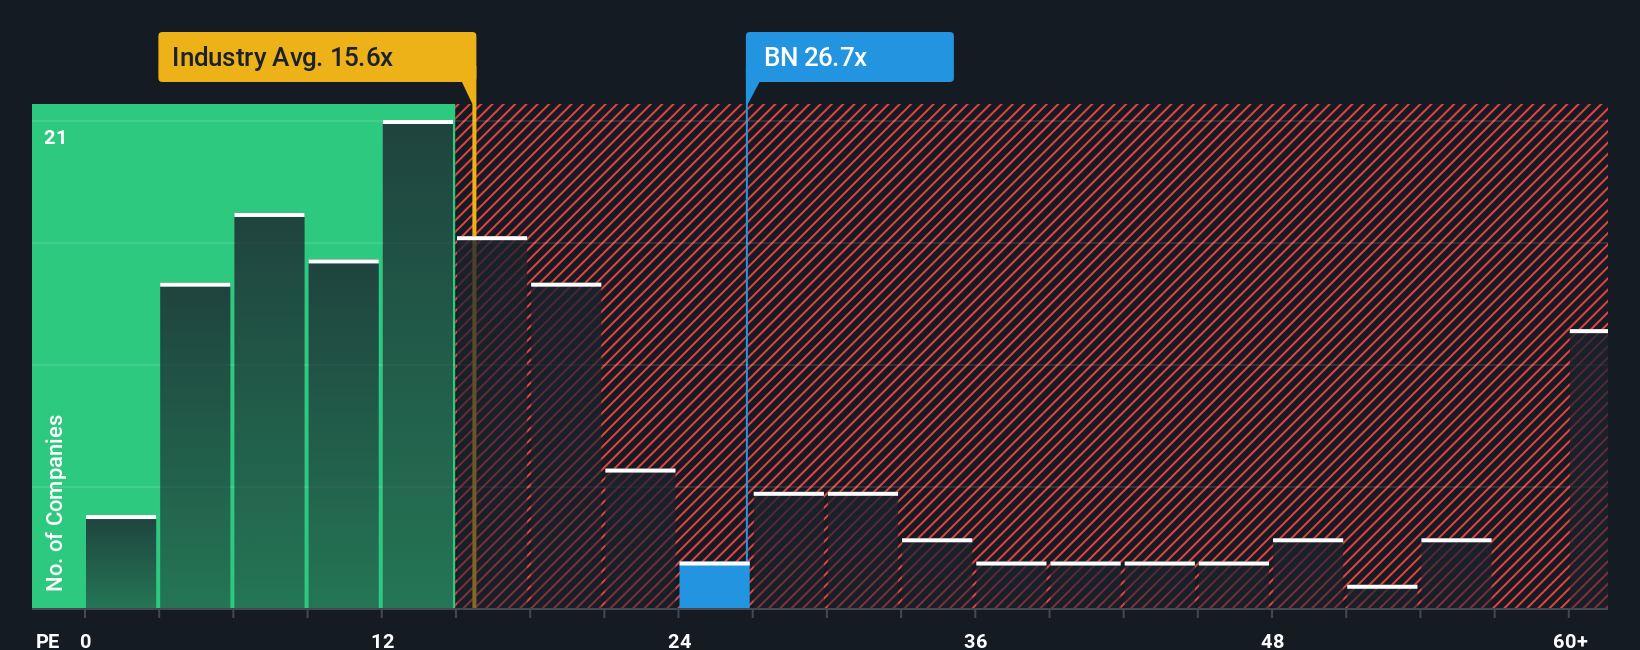
Danone currently trades on a P/E of 26.28x, compared with the Food industry average of 16.07x and a peer group average of 12.32x. Simply Wall St also provides a Fair Ratio of 25.13x, which is an estimate of what Danone’s P/E might be given factors such as its earnings profile, industry, profit margins, market value and key risks.
This Fair Ratio is more tailored than a simple peer or industry comparison, because it tries to adjust for differences in growth, profitability, risk and company size. Set against the current P/E, the Fair Ratio suggests Danone is slightly expensive on this metric.
Result: OVERVALUED
P/E ratios tell one story, but what if the real opportunity lies elsewhere? Discover 1442 companies where insiders are betting big on explosive growth.
Upgrade Your Decision Making: Choose your Danone Narrative
Earlier we mentioned that there is an even better way to think about valuation, and on Simply Wall St that comes through Narratives. This is where you set out your story for Danone, link it to a forecast for revenue, earnings and margins, and arrive at a fair value that you can easily compare to the current price. You can see this alongside other users on the Community page and watch it update automatically as fresh information such as news or earnings is incorporated. For example, one investor might build a Narrative that focuses on premium nutrition, emerging markets and margin resilience that points to a fair value around €80.35. Another might focus more on legacy product risks, execution challenges and cost pressures and land closer to the lower end of recent targets around €62. This gives you a clear, numbers backed way to decide whether the current price of about €74.32 aligns with your own view.
Do you think there's more to the story for Danone? Head over to our Community to see what others are saying!
This article by Simply Wall St is general in nature. We provide commentary based on historical data and analyst forecasts only using an unbiased methodology and our articles are not intended to be financial advice. It does not constitute a recommendation to buy or sell any stock, and does not take account of your objectives, or your financial situation. We aim to bring you long-term focused analysis driven by fundamental data. Note that our analysis may not factor in the latest price-sensitive company announcements or qualitative material. Simply Wall St has no position in any stocks mentioned.
Have feedback on this article? Concerned about the content? Get in touch with us directly. Alternatively, email editorial-team@simplywallst.com