
 Nasdaq
 華爾街日報
華爾街日報Is It Too Late To Consider Hawkins (HWKN) After Its Multi Year Share Price Surge
- If you are wondering whether Hawkins at around US$152 is still attractively priced after a strong multi year run, this breakdown is designed to help you size up the current valuation with clear, practical checks.
- The share price has seen a 6.6% gain over the last 30 days, a 4.6% return year to date, and a 33.7% return over the past year, while the 3 year return is very large at close to 3x.
- These moves have drawn more attention to how the market is treating specialty chemical suppliers like Hawkins, with investors weighing up longer term demand for its products and the resilience of its customer base. At the same time, the stock has had a 3.6% decline over the last week, which may leave some holders questioning whether expectations have run ahead of what the business can support.
- Our Simply Wall St valuation checks currently give Hawkins a 1 out of 6 valuation score, so next we will walk through standard valuation approaches, then finish with a broader way of thinking about valuation that can add extra context to those numbers.
Hawkins scores just 1/6 on our valuation checks. See what other red flags we found in the full valuation breakdown.
Approach 1: Hawkins Discounted Cash Flow (DCF) Analysis
A Discounted Cash Flow, or DCF, model estimates what a business could be worth today by projecting its future cash flows and then discounting those back to a single present value figure.
For Hawkins, the model uses a 2 Stage Free Cash Flow to Equity approach. The latest twelve month free cash flow is about $75.1 million. Analysts provide forecasts for the next few years, and beyond that Simply Wall St extrapolates cash flows, with the 2035 projection sitting at roughly $117.2 million.
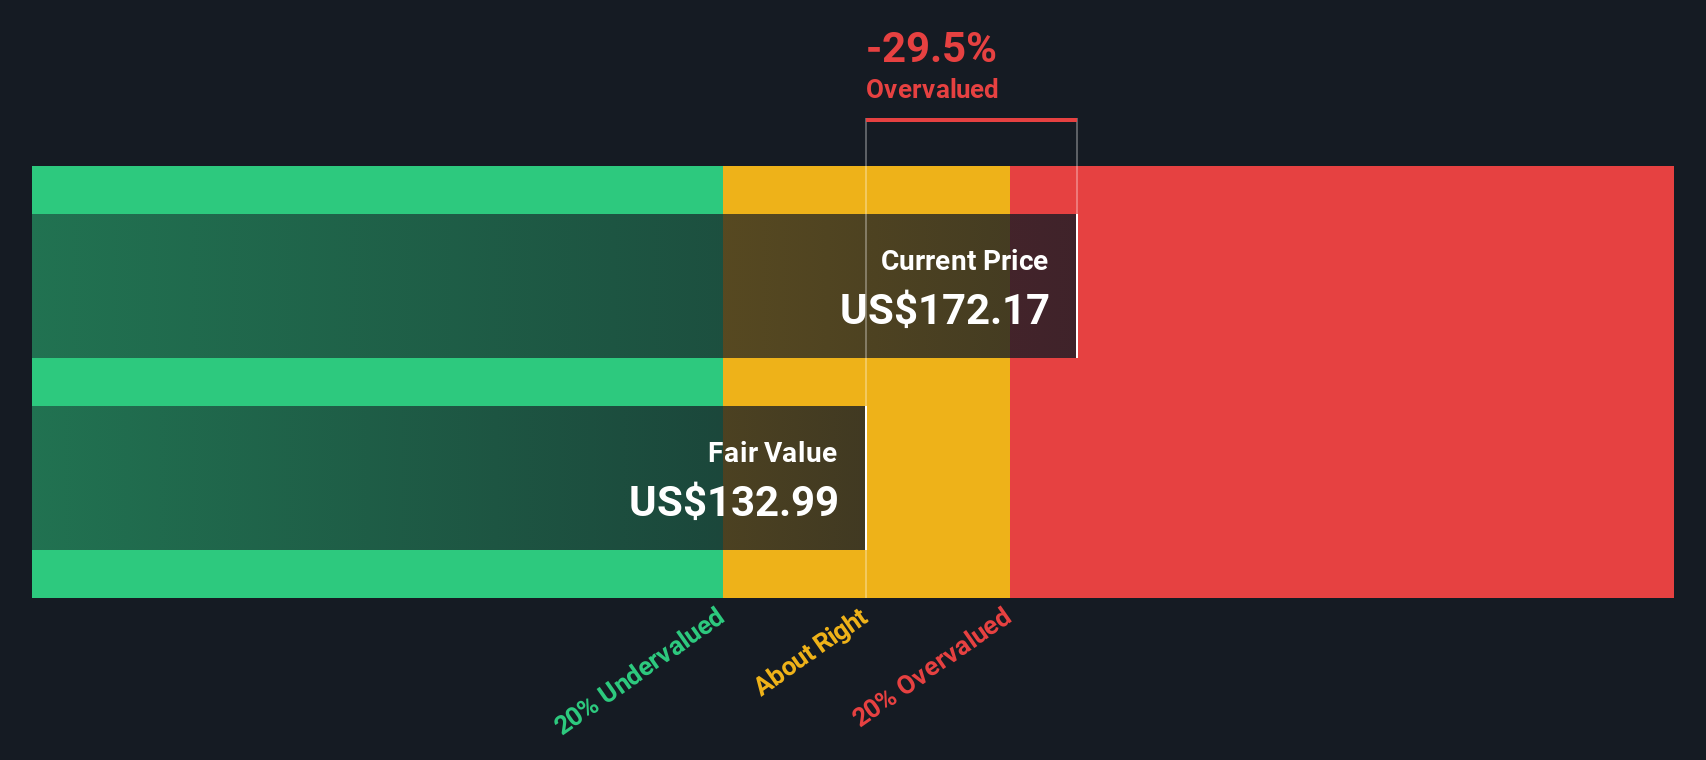
Bringing all those projected cash flows back to today gives an estimated intrinsic value of about $98.23 per share. Compared with the current share price around $152, the DCF output implies Hawkins is roughly 54.7% overvalued based on these assumptions and projections.
This model is sensitive to inputs. On the current settings it suggests that expectations embedded in the share price are well ahead of what the cash flow projections support.
Result: OVERVALUED
Our Discounted Cash Flow (DCF) analysis suggests Hawkins may be overvalued by 54.7%. Discover 871 undervalued stocks or create your own screener to find better value opportunities.
Approach 2: Hawkins Price vs Earnings
For profitable companies, the P/E ratio is a useful way to connect what you are paying for each share with the earnings the business is currently generating. A higher or lower P/E often reflects what the market is building in for future growth and how much risk investors feel they are taking on, so there is no single “right” number, but there is a range that usually fits a company’s profile.
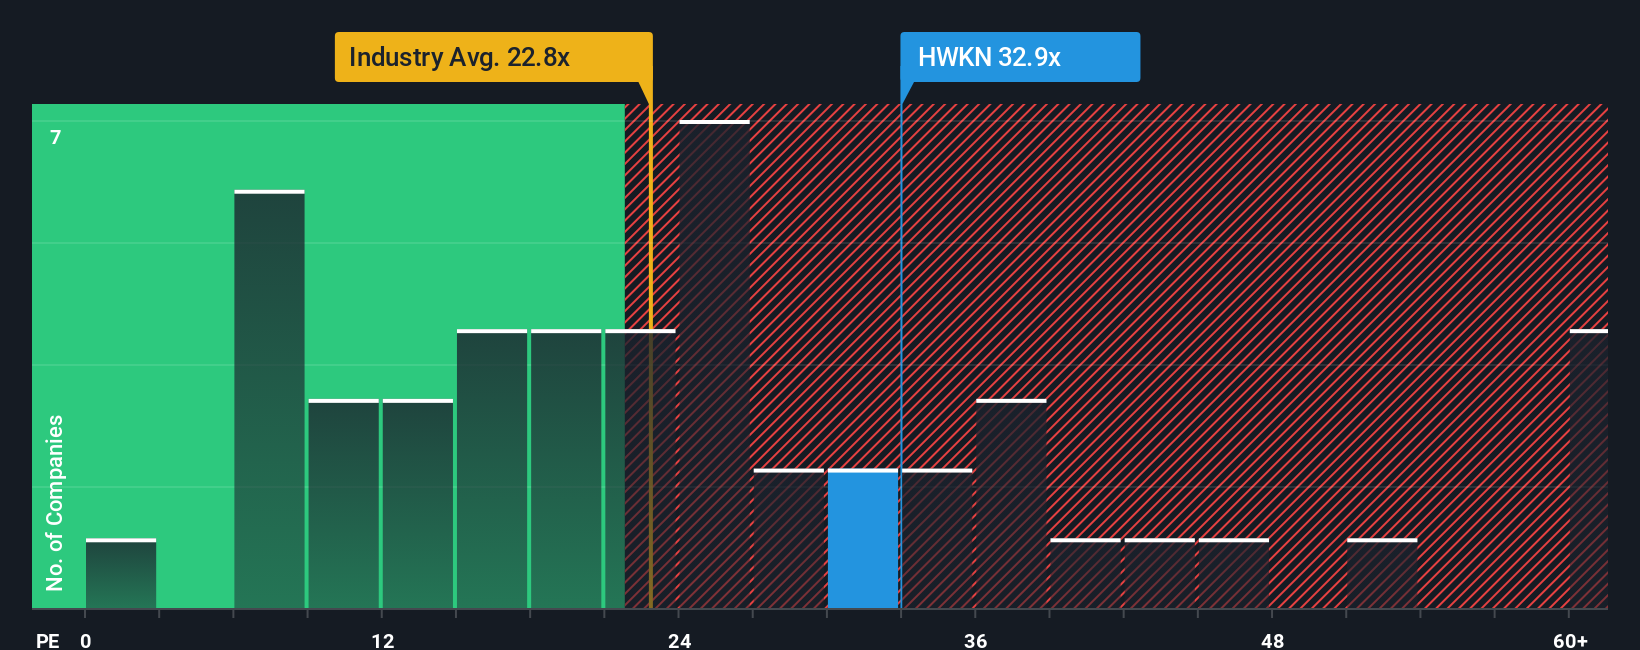
Hawkins trades on a P/E of 38.20x, compared with the Chemicals industry average of 23.16x and a peer average of 27.93x. Simply Wall St’s Fair Ratio framework estimates what a more tailored P/E might look like once you factor in elements such as earnings growth, profit margins, industry, market cap and specific risks.
For Hawkins, the Fair Ratio comes out at 17.02x. Because this approach adjusts for company specific characteristics rather than just lining Hawkins up against a broad industry group, it aims to give a more focused read on whether the current P/E is stretched or conservative. With the actual P/E of 38.20x sitting well above the 17.02x Fair Ratio, the shares screen as expensive on this metric.
Result: OVERVALUED
P/E ratios tell one story, but what if the real opportunity lies elsewhere? Discover 1442 companies where insiders are betting big on explosive growth.
Upgrade Your Decision Making: Choose your Hawkins Narrative
Earlier we mentioned that there is an even better way to understand valuation, so let us introduce you to Narratives, a simple way to attach your own story about Hawkins to the numbers behind its fair value, revenue, earnings and margins.
A Narrative on Simply Wall St connects three things in a straight line: what you think is happening with the business, how that feeds into a financial forecast, and the fair value that results from those assumptions.
You can create and explore Narratives on the Community page of Simply Wall St, where millions of investors use them to compare fair value with the current share price and decide whether Hawkins looks attractive, fully priced or expensive based on their own view.
Because Narratives update automatically when new information such as earnings results or company news is added, your view on Hawkins stays current without you needing to rebuild your whole model. You can see, for example, one investor tagging Hawkins as worth US$120 per share while another puts it closer to US$90, which shows how different stories about the same company can lead to very different fair values.
Do you think there's more to the story for Hawkins? Head over to our Community to see what others are saying!

This article by Simply Wall St is general in nature. We provide commentary based on historical data and analyst forecasts only using an unbiased methodology and our articles are not intended to be financial advice. It does not constitute a recommendation to buy or sell any stock, and does not take account of your objectives, or your financial situation. We aim to bring you long-term focused analysis driven by fundamental data. Note that our analysis may not factor in the latest price-sensitive company announcements or qualitative material. Simply Wall St has no position in any stocks mentioned.
Have feedback on this article? Concerned about the content? Get in touch with us directly. Alternatively, email editorial-team@simplywallst.com