
 Nasdaq
 華爾街日報
華爾街日報Is Mercedes-Benz Group (XTRA:MBG) Pricing Reflecting Its DCF And P/E Signals After Recent Pullback?
- If you are wondering whether Mercedes-Benz Group is attractively priced right now, this breakdown will help you see how the current share price lines up against several valuation checks.
- The stock trades at €60.37, with returns of 19.2% over 1 year and 78.4% over 5 years, while shorter term moves have been softer with a 2.5% decline over 7 days and a 0.6% decline over 30 days and year to date.
- Recent headlines around Mercedes-Benz Group have focused on its position in the global premium auto segment and how investors are weighing long term brand strength against short term share price swings. This mix of long horizon interest and recent pullbacks sets the scene for a closer look at what the current price might imply.
- On Simply Wall St's 6 point valuation framework, Mercedes-Benz Group scores 4 out of 6, which suggests some valuation checks point to the shares looking inexpensive. Next, we will run through those methods in more detail and then finish with a way to tie them together so you can judge whether the valuation really fits your own view of the company.
Approach 1: Mercedes-Benz Group Discounted Cash Flow (DCF) Analysis
A Discounted Cash Flow, or DCF, model projects a company’s future cash flows and then discounts them back to today to estimate what the entire business might be worth right now.
For Mercedes-Benz Group, the model used is a 2 Stage Free Cash Flow to Equity approach, based on cash flow projections in €. The latest twelve month Free Cash Flow is about €13.0b. Analysts provide detailed forecasts for several years. Simply Wall St extends those further, with projected Free Cash Flow of €6.2b in 2030. Intermediate years sit in between, with estimates such as €4.7b for 2026 and €6.3b for 2027, before moving into extrapolated values.
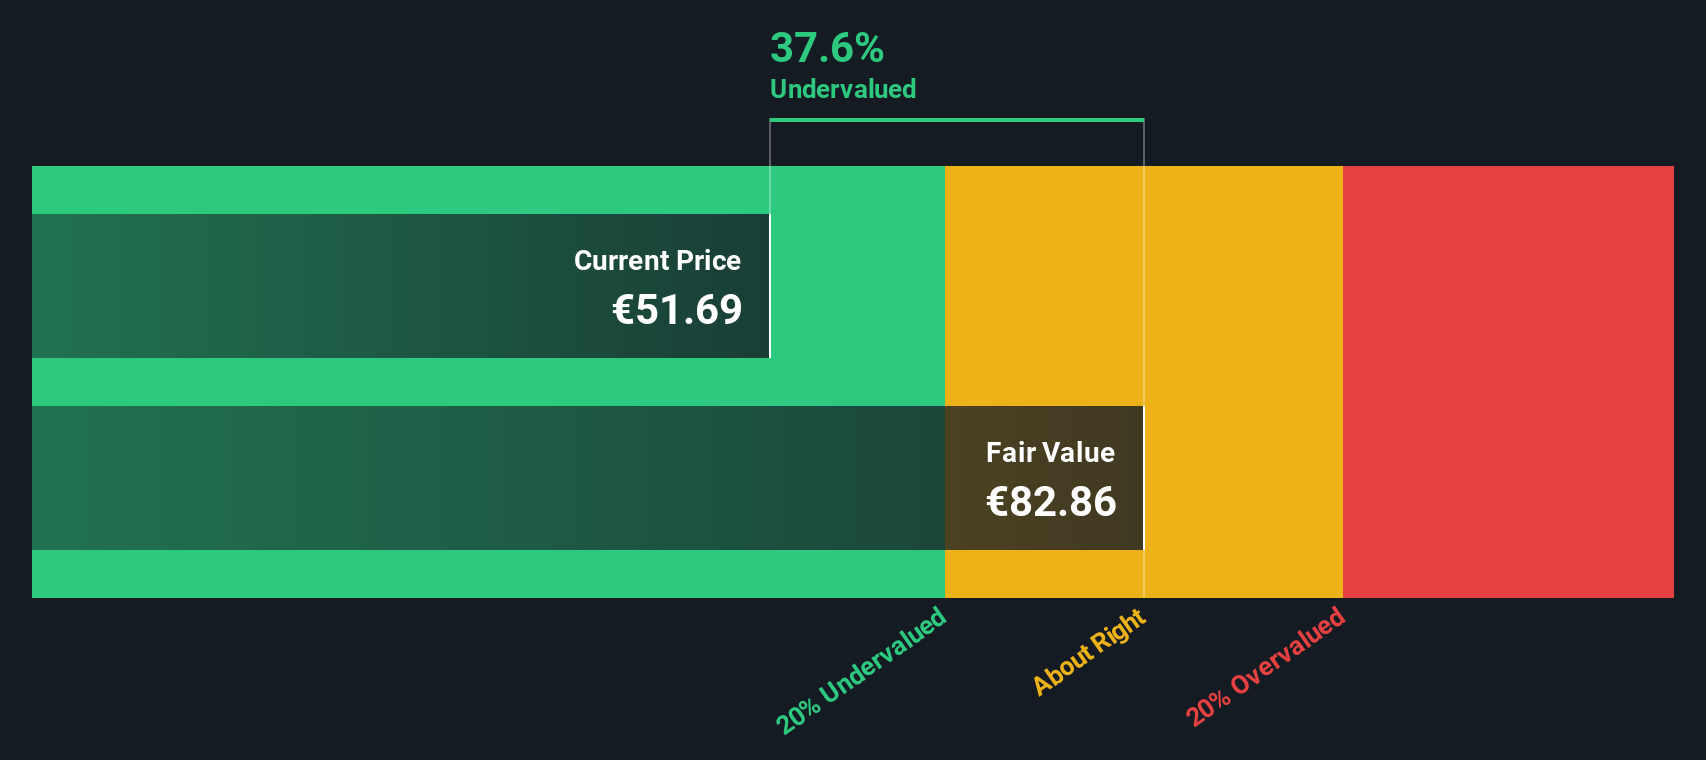
When all these projected cash flows are discounted and summed, the model arrives at an estimated intrinsic value of €69.63 per share. Compared with the current share price of €60.37, this implies the shares are about 13.3% below the DCF estimate, which points to Mercedes-Benz Group looking undervalued on this method.
Result: UNDERVALUED
Our Discounted Cash Flow (DCF) analysis suggests Mercedes-Benz Group is undervalued by 13.3%. Track this in your watchlist or portfolio, or discover 877 more undervalued stocks based on cash flows.
Approach 2: Mercedes-Benz Group Price vs Earnings
For a profitable company like Mercedes-Benz Group, the P/E ratio is a useful shorthand for how much investors are paying for each euro of current earnings. It lets you quickly compare what the market is willing to pay for one company’s earnings versus others in the same space.
What counts as a “normal” P/E depends a lot on expectations and risk. Higher expected earnings growth or lower perceived risk can justify a higher P/E, while lower growth or higher risk usually point to a lower multiple being reasonable.
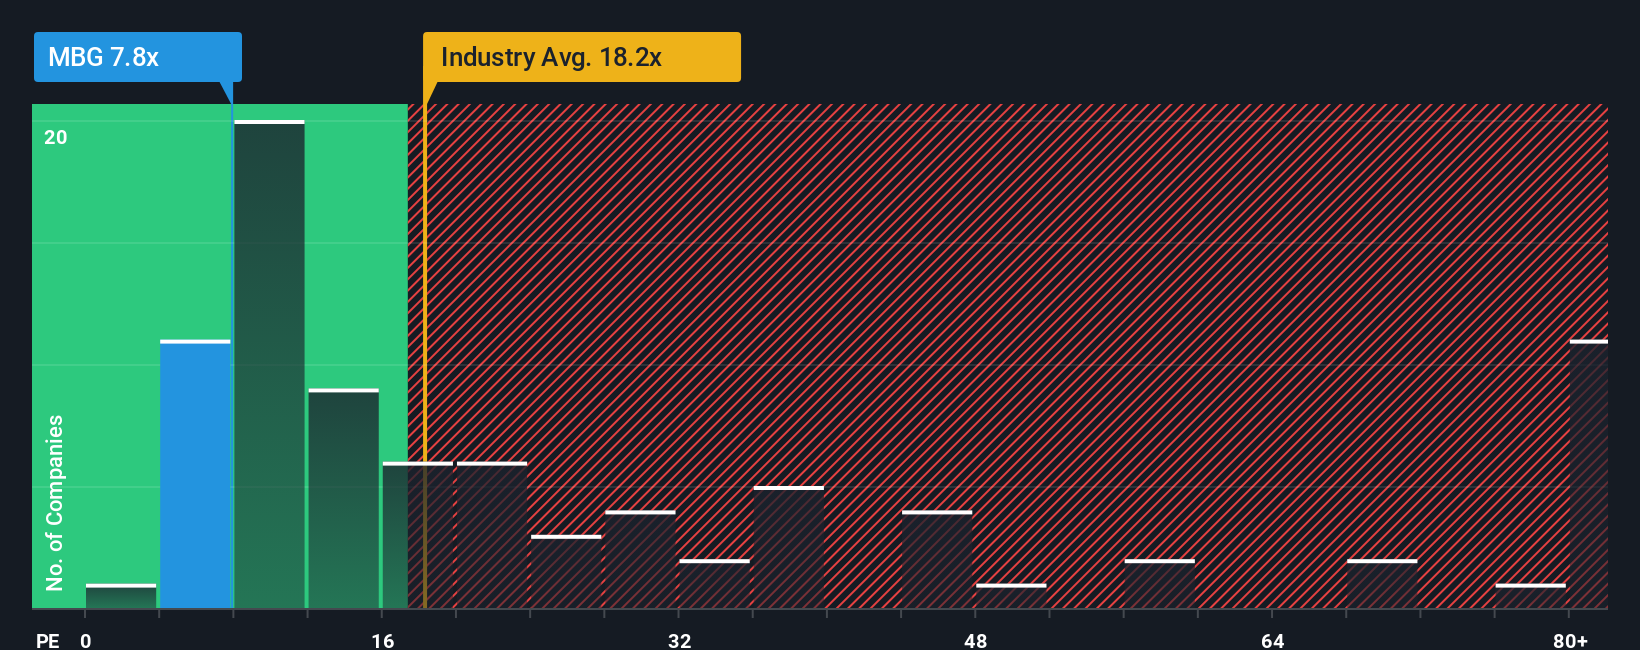
Mercedes-Benz Group currently trades on a P/E of 9.24x. That is well below the Auto industry average of 18.25x and the peer group average of 19.29x, so on simple comparisons the shares look cheaper than many rivals. Simply Wall St also calculates a proprietary “Fair Ratio” of 12.53x, which is the P/E they would expect given factors like earnings growth, industry, profit margin, market cap and risk profile. This Fair Ratio can be more informative than a straight industry or peer comparison because it is tailored to the company’s own characteristics rather than broad group averages.
With the current P/E of 9.24x below the Fair Ratio of 12.53x, the shares screen as undervalued on this metric.
Result: UNDERVALUED
P/E ratios tell one story, but what if the real opportunity lies elsewhere? Discover 1442 companies where insiders are betting big on explosive growth.
Upgrade Your Decision Making: Choose your Mercedes-Benz Group Narrative
Earlier we mentioned that there is an even better way to understand valuation, so let us introduce you to Narratives. These are simply your own stories about Mercedes-Benz Group that link what you think about its electric models, digital platforms and margin risks to a set of revenue, earnings and margin forecasts. From there, you can connect those forecasts to a fair value that you can easily compare with the current share price inside the Narratives tool on Simply Wall St's Community page. In this tool, Narratives update automatically when new news or earnings arrive. You can see, for example, one investor building a Mercedes-Benz Group Narrative around premium positioning, recurring software revenues and a fair value closer to the higher analyst target of €83.00. Another investor might focus on China demand, tariffs, electric vehicle execution risk and a fair value nearer the lower target of €40.00. This gives you a clear way to decide how your own fair value compares to the current price and whether that gap is large enough to consider your preferred investment stance.
Do you think there's more to the story for Mercedes-Benz Group? Head over to our Community to see what others are saying!

This article by Simply Wall St is general in nature. We provide commentary based on historical data and analyst forecasts only using an unbiased methodology and our articles are not intended to be financial advice. It does not constitute a recommendation to buy or sell any stock, and does not take account of your objectives, or your financial situation. We aim to bring you long-term focused analysis driven by fundamental data. Note that our analysis may not factor in the latest price-sensitive company announcements or qualitative material. Simply Wall St has no position in any stocks mentioned.
Have feedback on this article? Concerned about the content? Get in touch with us directly. Alternatively, email editorial-team@simplywallst.com