
 Nasdaq
 華爾街日報
華爾街日報Is First Solar (FSLR) Pricing Reflecting Recent Share Pullback And Growth Expectations
- If you are wondering whether First Solar's recent share price justifies the current valuation, you are not alone. This article is built to help you frame that question clearly.
- The stock last closed at US$246.26, with returns of 28.8% over 1 year, 37.7% over 3 years and 132.2% over 5 years. The year-to-date return of a 10.2% decline and recent 7-day and 30-day returns of 5.7% and 2.8% declines hint at shifting expectations.
- Recent news coverage of First Solar has focused on its position as a major US-listed solar manufacturer and a key name within clean energy investing. This helps explain why it often sits in the spotlight when sentiment toward renewable energy shifts. These headlines tend to influence how investors weigh both the long-term opportunity in solar power and the risks that can come with policy changes or competition.
- On Simply Wall St's valuation checks, First Solar scores 5 out of 6. Next, we will look at how different valuation methods line up on this stock and then finish with a framework that may help you think about its value even more clearly.
Find out why First Solar's 28.8% return over the last year is lagging behind its peers.
Approach 1: First Solar Discounted Cash Flow (DCF) Analysis
A Discounted Cash Flow model estimates what a company might be worth by projecting its future cash flows and then discounting those back to today using a required rate of return. It is essentially asking what those future dollars are worth in your pocket right now.
For First Solar, the model used is a 2 Stage Free Cash Flow to Equity approach. The latest twelve month free cash flow is reported as a loss of $22.42m, but analysts and extrapolations point to free cash flow reaching $3.35b in 2030. The ten year path to that point includes projected annual free cash flows in the low to mid billions of dollars, with the earlier years guided mainly by analyst estimates and the later years extended by Simply Wall St’s own assumptions.
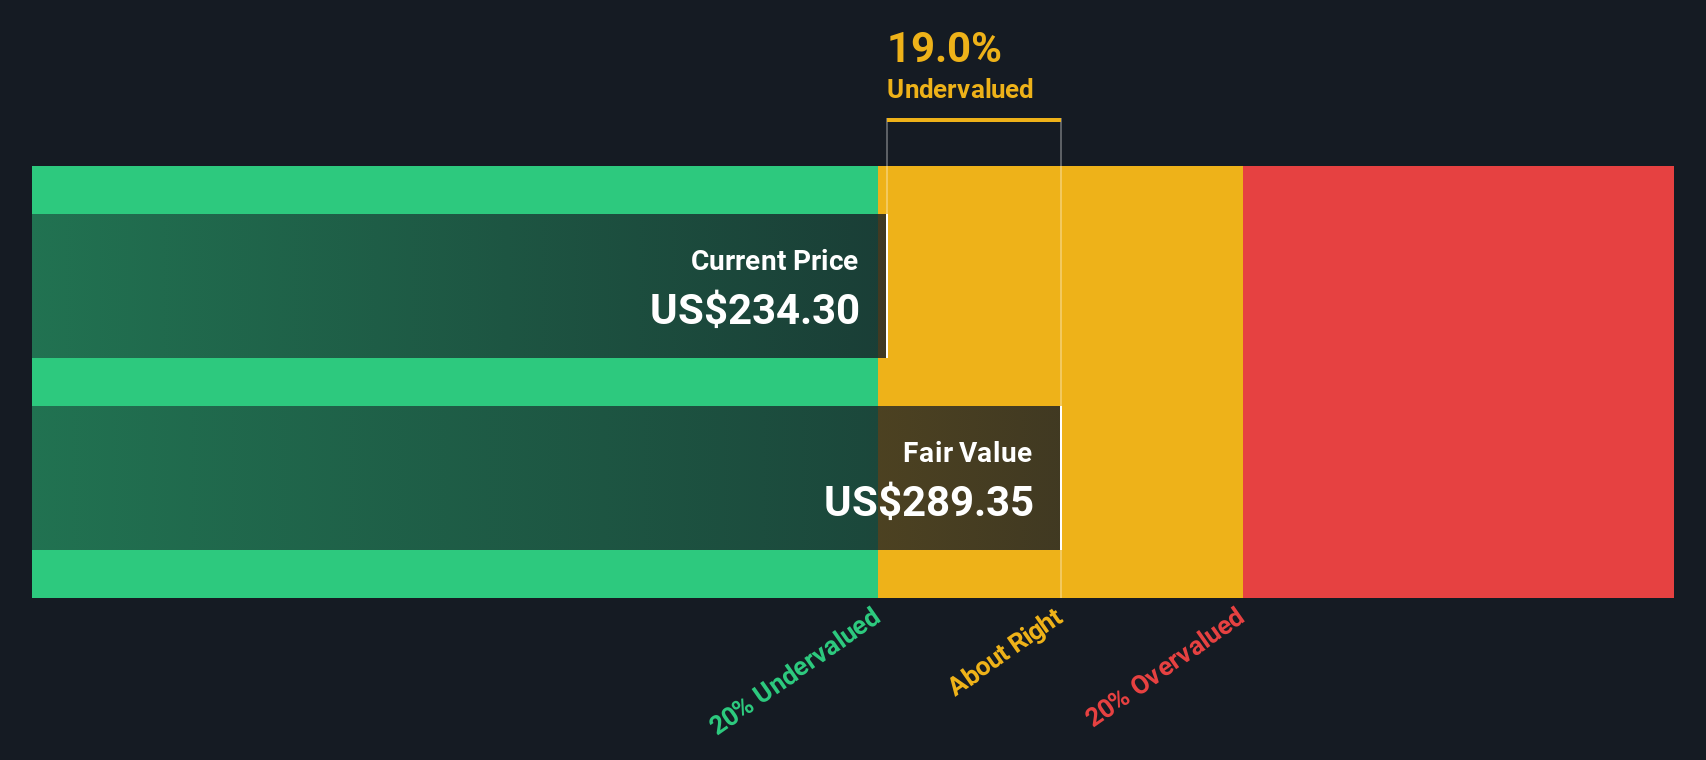
When all of those projected cash flows are discounted back to today, Simply Wall St calculates an estimated intrinsic value of about $303.80 per share. Compared with the recent share price of $246.26, this model indicates the stock is 18.9% undervalued.
Result: UNDERVALUED
Our Discounted Cash Flow (DCF) analysis suggests First Solar is undervalued by 18.9%. Track this in your watchlist or portfolio, or discover 880 more undervalued stocks based on cash flows.
Approach 2: First Solar Price vs Earnings
For profitable companies, the P/E ratio is a useful yardstick because it ties the share price directly to the earnings that ultimately support it. Investors usually accept a higher P/E when they expect stronger growth or see lower risk, and a lower P/E when growth expectations are modest or the risk profile is higher.
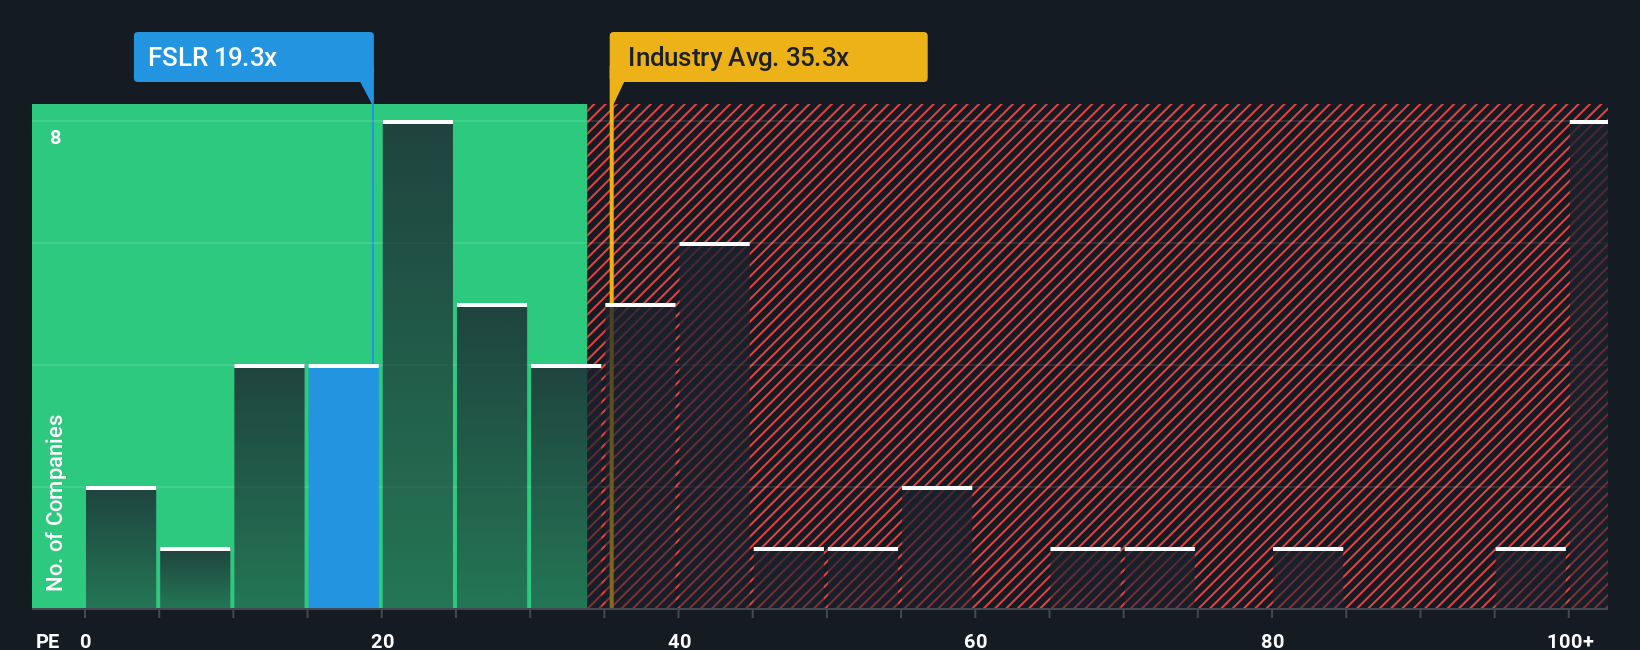
First Solar currently trades on a P/E of 18.9x. That sits below the broader Semiconductor industry average of 42.3x and also below a peer group average of 66.2x. On the surface, that might suggest a more cautious market view of First Solar compared with some peers.
Simply Wall St’s Fair Ratio model estimates that, given factors such as First Solar’s earnings growth profile, industry, profit margins, market cap and risks, a more tailored P/E would be 38.4x. This Fair Ratio approach can be more informative than a simple peer or industry comparison because it adjusts for company specific characteristics rather than assuming one size fits all. Comparing 18.9x to the 38.4x Fair Ratio, First Solar’s shares screen as trading below that company specific reference level.
Result: UNDERVALUED
P/E ratios tell one story, but what if the real opportunity lies elsewhere? Discover 1446 companies where insiders are betting big on explosive growth.
Upgrade Your Decision Making: Choose your First Solar Narrative
Earlier we mentioned that there is an even better way to understand valuation. Narratives on Simply Wall St let you write the story you believe about First Solar, translate that story into your own assumptions for future revenue, earnings and margins, connect those assumptions to a fair value, and then compare that fair value to the current price. The tools update as fresh news or earnings arrive. For example, one investor on the Community page might build a Narrative that supports a higher fair value closer to the US$287 analyst target, while another might lean toward the US$100 end of the range. Seeing those different paths side by side can make your own decisions much clearer.
Do you think there's more to the story for First Solar? Head over to our Community to see what others are saying!
This article by Simply Wall St is general in nature. We provide commentary based on historical data and analyst forecasts only using an unbiased methodology and our articles are not intended to be financial advice. It does not constitute a recommendation to buy or sell any stock, and does not take account of your objectives, or your financial situation. We aim to bring you long-term focused analysis driven by fundamental data. Note that our analysis may not factor in the latest price-sensitive company announcements or qualitative material. Simply Wall St has no position in any stocks mentioned.
Have feedback on this article? Concerned about the content? Get in touch with us directly. Alternatively, email editorial-team@simplywallst.com