
 Nasdaq
 華爾街日報
華爾街日報Is Mastercard (MA) Pricing Fair After Recent Digital Payments Partnerships And Premium P/E Ratio
- If you are wondering whether Mastercard's current share price still offers value, you are not alone. This article breaks down what the market might be pricing in and how that stacks up against several valuation checks.
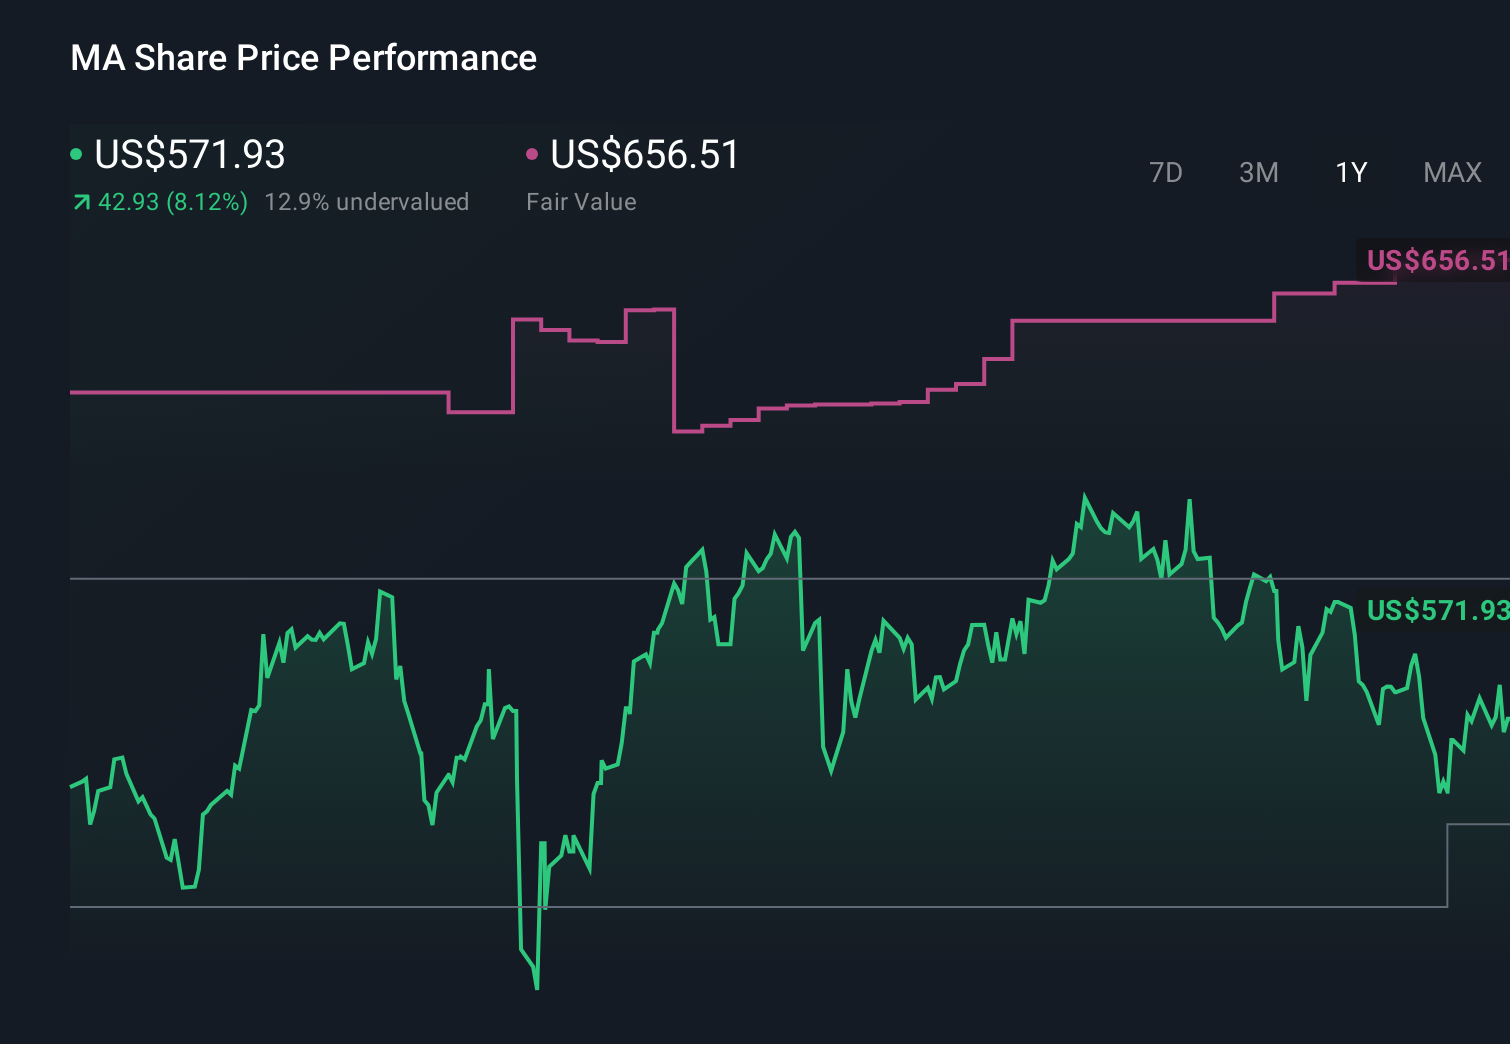
- Over the last week Mastercard returned 1.6%, over the last month 7.9%, year to date 3.0%, over the last year 13.0%, about 3 years 55.2% and about 5 years 82.3%. This gives useful context before you weigh up what you are paying today.
- Recent headlines around Mastercard have focused on its role in global digital payments and ongoing partnerships with banks, fintechs and merchants. These factors continue to shape how investors think about its long term relevance. At the same time, regulatory discussions and competition in payments are often cited in market commentary as influences on how much of a premium investors are willing to pay for the stock.
- On our checks Mastercard scores a 2 out of 6 valuation score. We will break this down using different approaches, and then finish by looking at a broader way to think about what the market is really pricing in.
Mastercard scores just 2/6 on our valuation checks. See what other red flags we found in the full valuation breakdown.
Approach 1: Mastercard Excess Returns Analysis
The Excess Returns model asks a simple question: are Mastercard’s projected profits high enough, relative to its equity base and cost of capital, to create value for shareholders over time, and what is that stream of value worth per share today.
On this framework, Mastercard is modeled with a Book Value of $8.78 per share and a Stable Book Value of $14.68 per share, based on estimates from 8 analysts. Against that equity base, the model uses a Stable EPS of $31.40 per share, sourced from weighted future Return on Equity estimates from 11 analysts. The implied average Return on Equity is very large, at about 2x equity, while the Cost of Equity is set at $1.09 per share. This leaves an Excess Return of $30.31 per share, which is the profit above the required shareholder return that the company is expected to generate each year in a stable state.
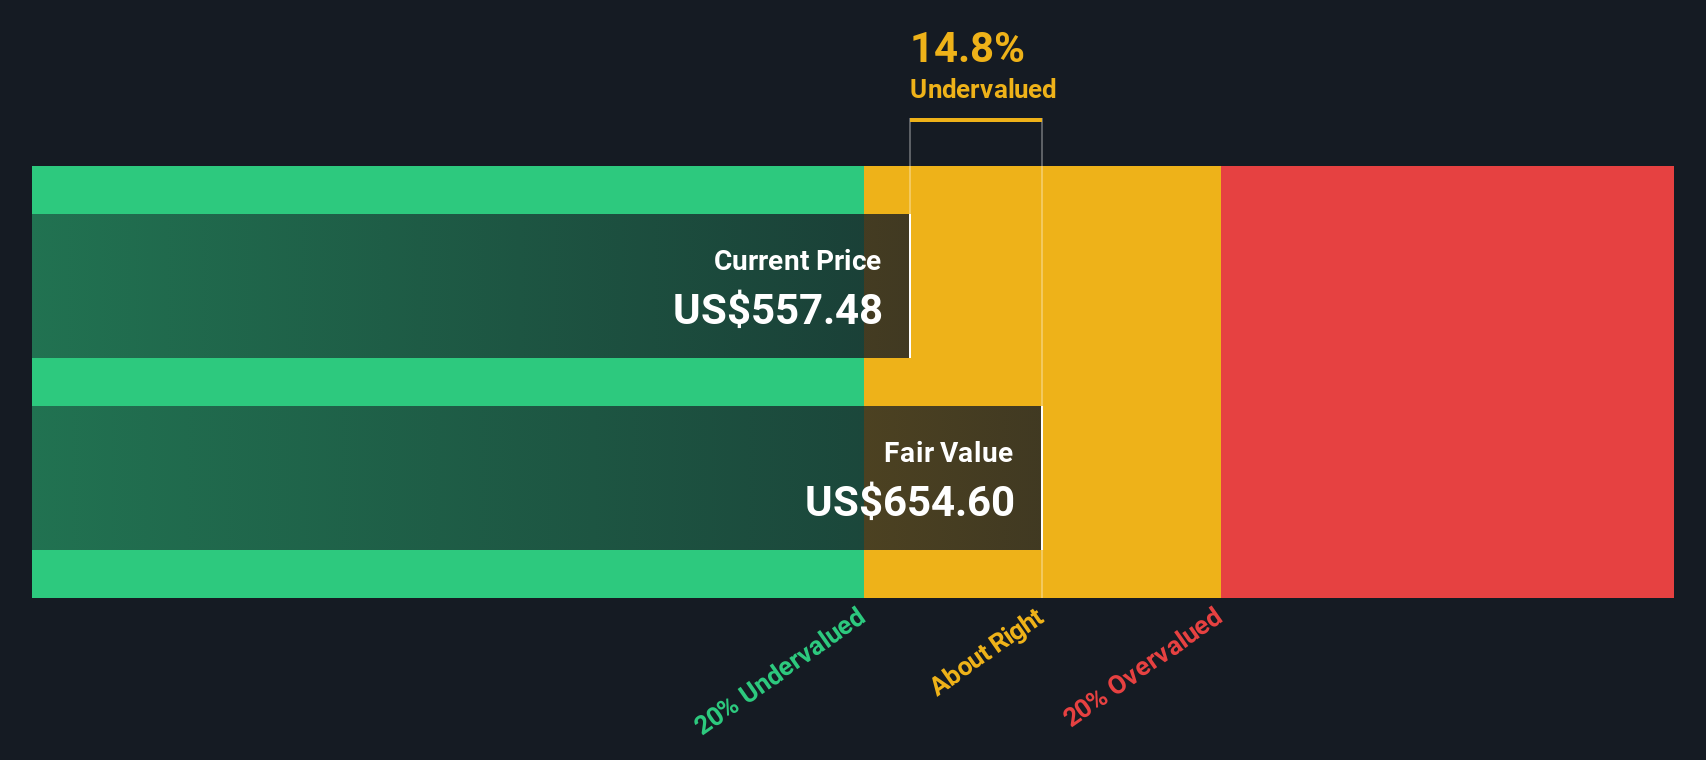
Discounting these excess earnings gives an intrinsic value estimate of about $743.60 per share, which implies the stock is 22.0% undervalued relative to its current price.
Result: UNDERVALUED
Our Excess Returns analysis suggests Mastercard is undervalued by 22.0%. Track this in your watchlist or portfolio, or discover 881 more undervalued stocks based on cash flows.
Approach 2: Mastercard Price vs Earnings
For profitable companies like Mastercard, the P/E ratio is a common yardstick because it tells you how much you are paying for each dollar of current earnings. Investors usually accept a higher P/E when they expect stronger earnings growth or see the business as lower risk, and a lower P/E when growth expectations are more muted or risks feel higher.
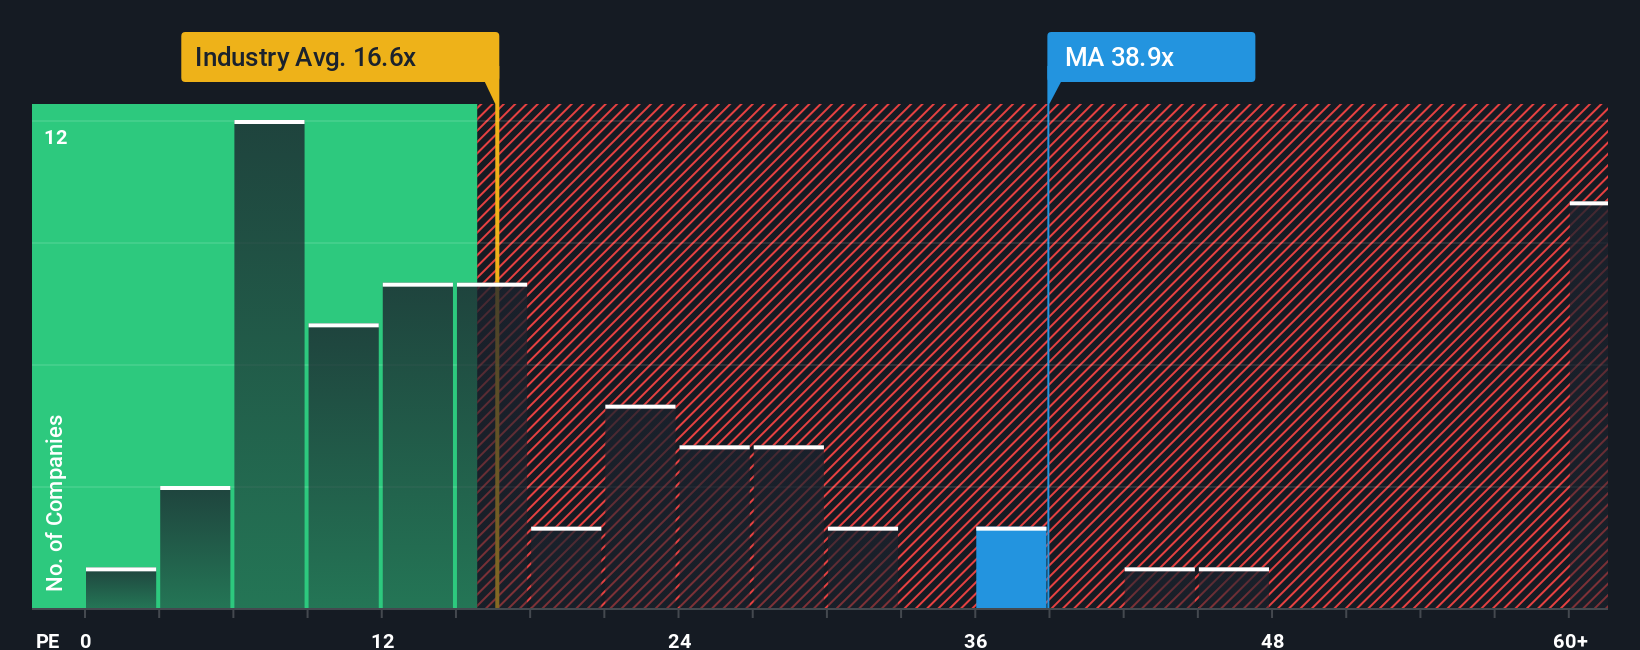
Right now, Mastercard trades on a P/E of 36.55x. That sits well above the Diversified Financial industry average of 14.20x and also above the peer average of 17.22x. On simple comparisons, the shares therefore carry a clear premium.
Simply Wall St’s Fair Ratio for Mastercard is 20.40x. This is a proprietary estimate of what a reasonable P/E might look like after considering factors such as earnings growth, the company’s industry, profit margins, market value and risk profile. Because it blends these elements into a single figure, the Fair Ratio can be more tailored than a broad industry or peer comparison, which treats very different businesses as if they are the same.
Comparing Mastercard’s current P/E of 36.55x with the Fair Ratio of 20.40x suggests the shares are trading above what this framework would view as a fair level.
Result: OVERVALUED
P/E ratios tell one story, but what if the real opportunity lies elsewhere? Discover 1446 companies where insiders are betting big on explosive growth.
Upgrade Your Decision Making: Choose your Mastercard Narrative
Earlier we mentioned that there is an even better way to think about valuation. Narratives on Simply Wall St let you attach a clear story about Mastercard to the numbers by spelling out your view on its future revenue, earnings and margins, linking that story to a forecast and then to a fair value that you can compare with today’s price to help decide when to buy or sell. This is all within an easy tool on the Community page that automatically refreshes when new news or earnings arrive. One investor might build a Mastercard Narrative that lines up with the higher fair value near US$690 based on strong digital and cross border payments growth, while another could lean toward the lower end around US$520 if they focus more on competition, regulation and earnings risk.
Do you think there's more to the story for Mastercard? Head over to our Community to see what others are saying!
This article by Simply Wall St is general in nature. We provide commentary based on historical data and analyst forecasts only using an unbiased methodology and our articles are not intended to be financial advice. It does not constitute a recommendation to buy or sell any stock, and does not take account of your objectives, or your financial situation. We aim to bring you long-term focused analysis driven by fundamental data. Note that our analysis may not factor in the latest price-sensitive company announcements or qualitative material. Simply Wall St has no position in any stocks mentioned.
Have feedback on this article? Concerned about the content? Get in touch with us directly. Alternatively, email editorial-team@simplywallst.com