
 Nasdaq
 華爾街日報
華爾街日報Is HCI Group (HCI) Pricing Look Attractive After Recent Share Price Pullback
- If you are wondering whether HCI Group's current share price lines up with its underlying value, you are not alone. This article is built to help you make sense of that question step by step.
- HCI Group's share price closed at US$173.71, with a 1 year return of 53.3% and a 3 year return that is very large, while the stock has seen a 9.4% decline over the last 7 days and a 5.5% decline year to date.
- These recent moves sit alongside HCI Group's longer term share price record, including a 30 day return of 2.2% and a 5 year return of 256.6%. Taken together, this mix of short term pullbacks and strong multi year returns gives useful context for thinking about what the stock might be worth today.
- On Simply Wall St's 6 point valuation framework, HCI Group scores a full 6 out of 6. Next we will walk through what traditional valuation checks say about the stock, before finishing with a way to look at value that can give you an even clearer picture.
Approach 1: HCI Group Excess Returns Analysis
The Excess Returns model evaluates how much profit a company generates above the return that equity investors typically require, then links that to the value of its equity per share.
For HCI Group, the starting point is a Book Value of US$63.41 per share and a Stable EPS of US$27.31 per share, based on the median return on equity from the past 5 years. The model applies a Cost of Equity of US$6.30 per share, which implies an Excess Return of US$21.01 per share. That excess is supported by an Average Return on Equity of 30.14% and a Stable Book Value estimate of US$90.63 per share, using weighted future book value estimates from 3 analysts.
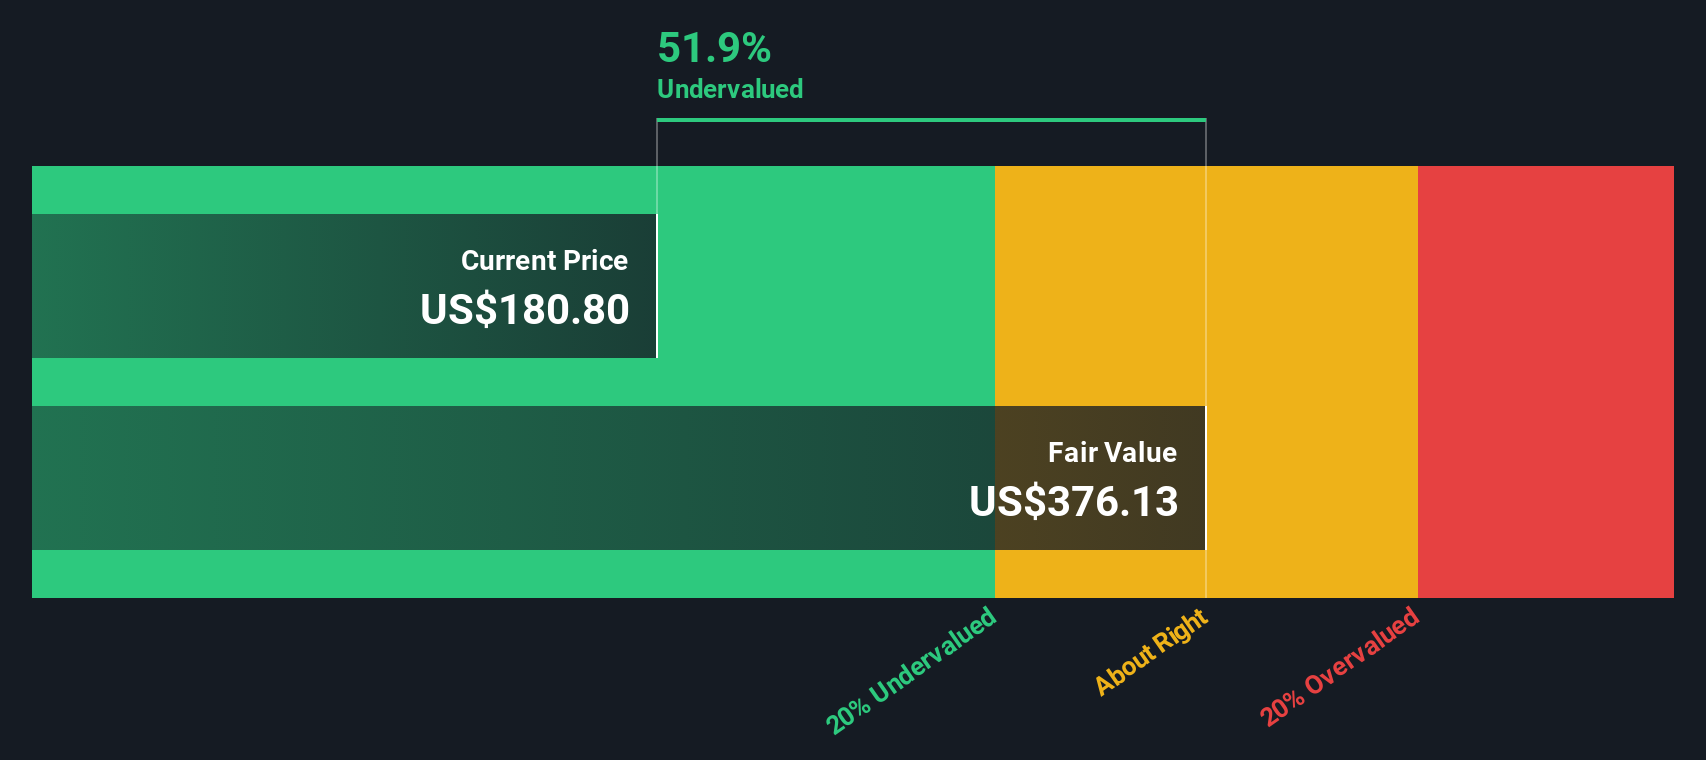
Combining these inputs, the Excess Returns model arrives at an estimated intrinsic value of about US$659.09 per share. Compared with the recent share price of US$173.71, this framework implies the stock is around 73.6% undervalued on this measure.
Result: UNDERVALUED
Our Excess Returns analysis suggests HCI Group is undervalued by 73.6%. Track this in your watchlist or portfolio, or discover 883 more undervalued stocks based on cash flows.
Approach 2: HCI Group Price vs Earnings
For profitable companies, the P/E ratio is a useful way to relate what you are paying for each share to the earnings that support that price. A higher or lower P/E often reflects the balance between how quickly earnings are expected to grow and how much risk investors see in those earnings.
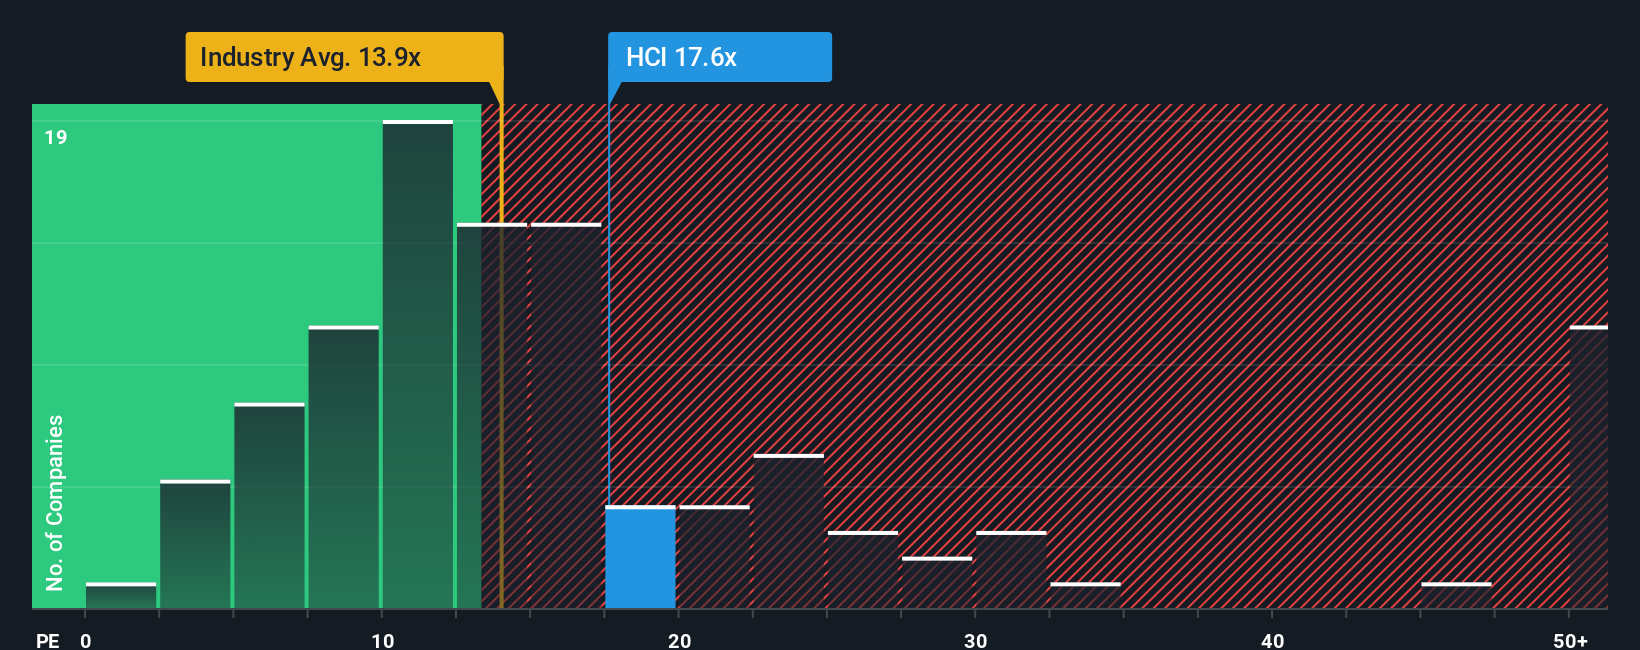
HCI Group currently trades on a P/E of 11.39x. That sits below the Insurance industry average of 12.93x and below the peer group average of 31.47x, which already suggests the stock is priced more cautiously than many peers.
Simply Wall St's Fair Ratio for HCI Group is 12.89x. This is a proprietary estimate of what a reasonable P/E might be, given factors such as the company’s earnings growth profile, profit margins, industry, market cap and risk characteristics. Because it blends these company specific inputs, the Fair Ratio can be more informative than a simple comparison with industry or peer averages, which do not adjust for differences in quality or risk. On this framework, HCI Group’s actual P/E of 11.39x is below the Fair Ratio of 12.89x.
Result: UNDERVALUED
P/E ratios tell one story, but what if the real opportunity lies elsewhere? Discover 1446 companies where insiders are betting big on explosive growth.
Upgrade Your Decision Making: Choose your HCI Group Narrative
Earlier we mentioned that there is an even better way to understand valuation. Narratives let you attach a clear story about HCI Group to your own numbers by linking your view of its future revenue, earnings and margins to a financial forecast, a fair value, and ultimately a decision on whether its fair value and the current price line up. All of this happens inside Simply Wall St’s Community page where millions of investors share views. Each Narrative updates as new news or earnings arrive. One investor might see HCI Group as worth US$234 per share based on assumptions similar to the current analyst fair value, while another might lean closer to the lower analyst price target of US$190 if they put more weight on risks around Florida exposure, reinsurance costs or the Exzeo IPO.
Do you think there's more to the story for HCI Group? Head over to our Community to see what others are saying!

This article by Simply Wall St is general in nature. We provide commentary based on historical data and analyst forecasts only using an unbiased methodology and our articles are not intended to be financial advice. It does not constitute a recommendation to buy or sell any stock, and does not take account of your objectives, or your financial situation. We aim to bring you long-term focused analysis driven by fundamental data. Note that our analysis may not factor in the latest price-sensitive company announcements or qualitative material. Simply Wall St has no position in any stocks mentioned.
Have feedback on this article? Concerned about the content? Get in touch with us directly. Alternatively, email editorial-team@simplywallst.com