
 Nasdaq
 華爾街日報
華爾街日報Has Interactive Brokers Group (IBKR) Share Price Outpaced Its Fundamentals Too Quickly?
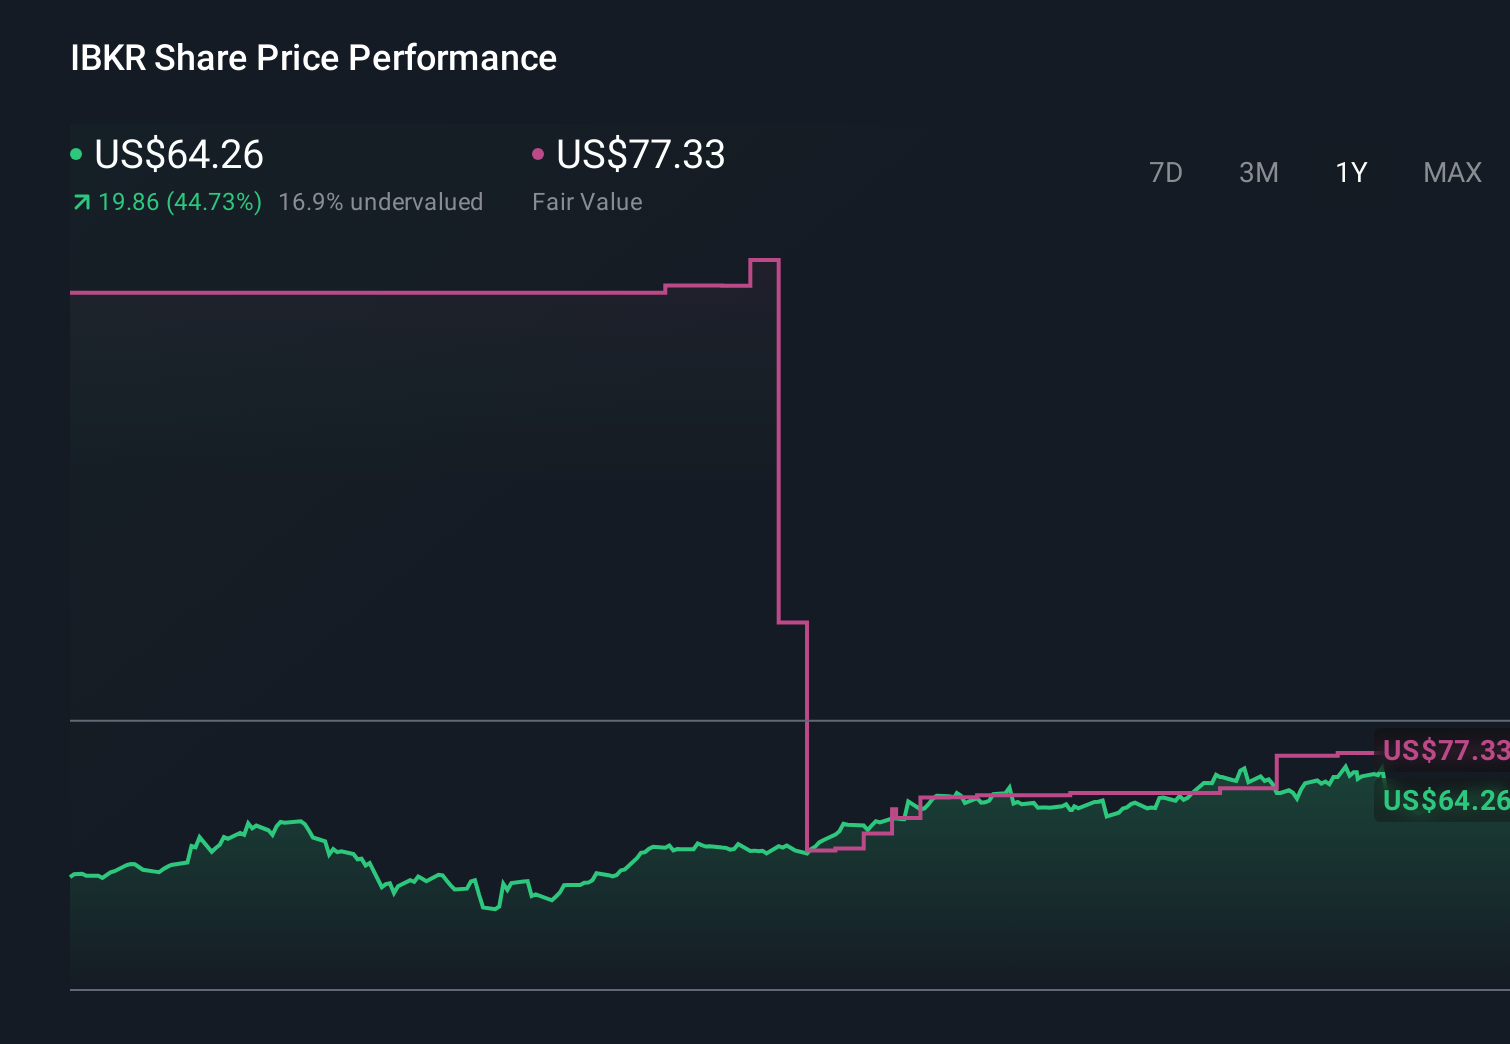
- If you are wondering whether Interactive Brokers Group's current share price offers good value or not, it helps to line up the recent performance with what the fundamentals might be pointing to.
- The stock last closed at US$71.34, with returns of 10.9% over 7 days, 8.4% over 30 days, 6.1% year to date, 50.3% over 1 year and 288.7% over 3 years. These figures can change how investors think about both growth potential and risk.
- Recent coverage has focused on Interactive Brokers Group's position in online brokerage and trading services, as investors weigh its role in a sector where digital platforms and low cost access are key themes. This context helps frame why the stock's strong multi year returns and recent moves are attracting fresh attention.
- Right now, Interactive Brokers Group scores 0 out of 6 on our valuation checks. Next we will walk through the standard valuation methods investors often rely on, before finishing with a way to think about value that can tie all these approaches together.
Interactive Brokers Group scores just 0/6 on our valuation checks. See what other red flags we found in the full valuation breakdown.
Approach 1: Interactive Brokers Group Excess Returns Analysis
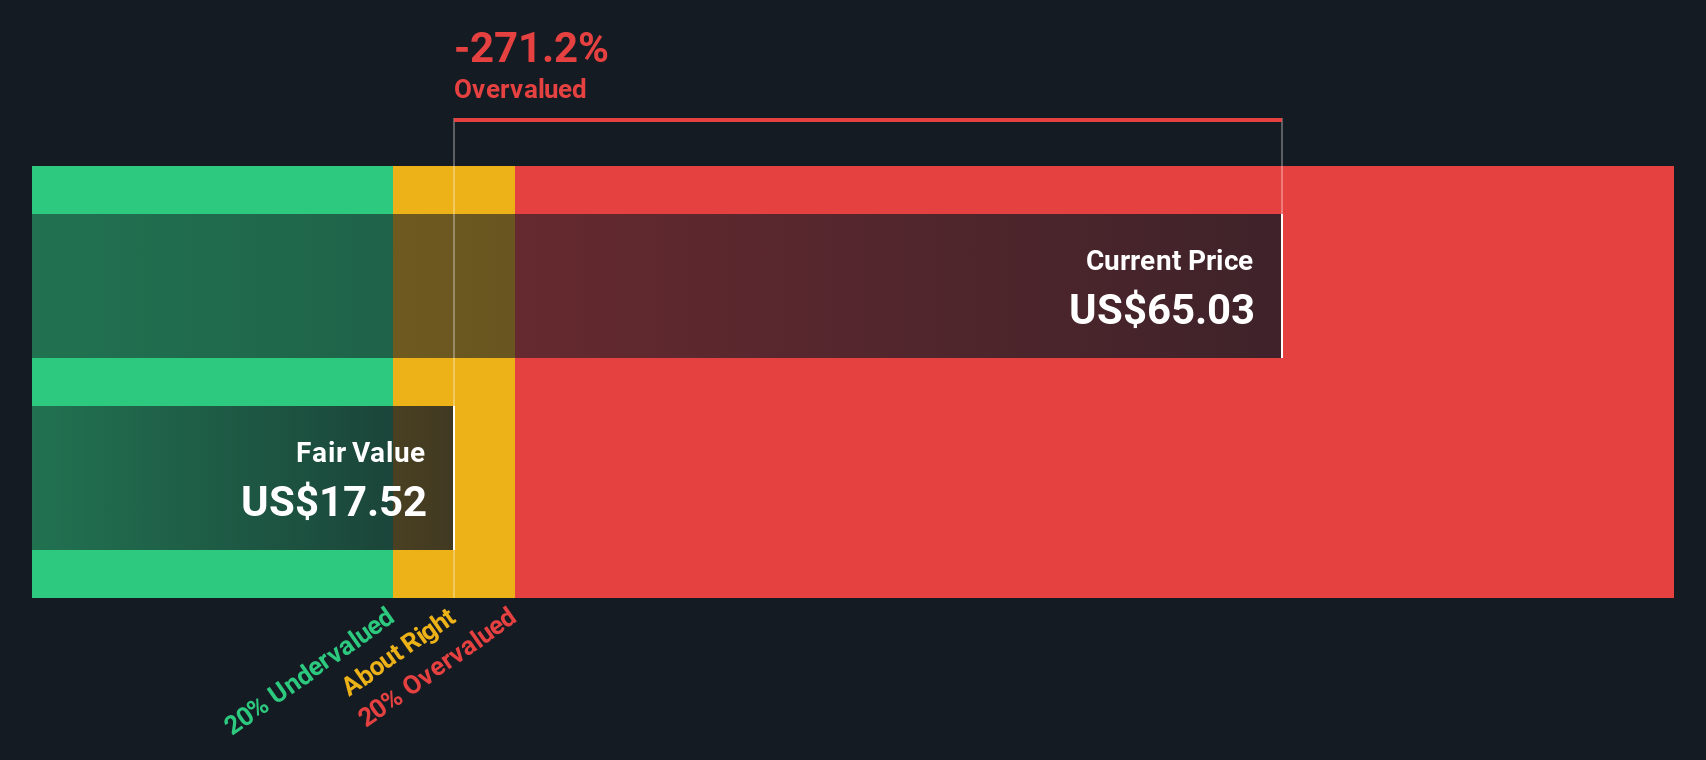
The Excess Returns model looks at how much profit a company generates over and above the return that equity investors typically require, then sums those “excess” profits to estimate what the business could be worth per share today.
For Interactive Brokers Group, the starting point is its Book Value of $11.47 per share and a Stable EPS of $1.73 per share, based on the median return on equity from the past 5 years. The model applies a Cost of Equity of $0.75 per share, leaving an Excess Return of $0.97 per share. That excess is linked to an Average Return on Equity of 19.83% and a Stable Book Value of $8.71 per share, again taken from historical medians.
Using these inputs, the Excess Returns model arrives at an estimated intrinsic value of about $26.71 per share. Compared with the recent share price of $71.34, this implies the stock is 167.1% overvalued on this measure. In short, this approach suggests the current price already embeds very optimistic expectations.
Result: OVERVALUED
Our Excess Returns analysis suggests Interactive Brokers Group may be overvalued by 167.1%. Discover 883 undervalued stocks or create your own screener to find better value opportunities.
Approach 2: Interactive Brokers Group Price vs Earnings
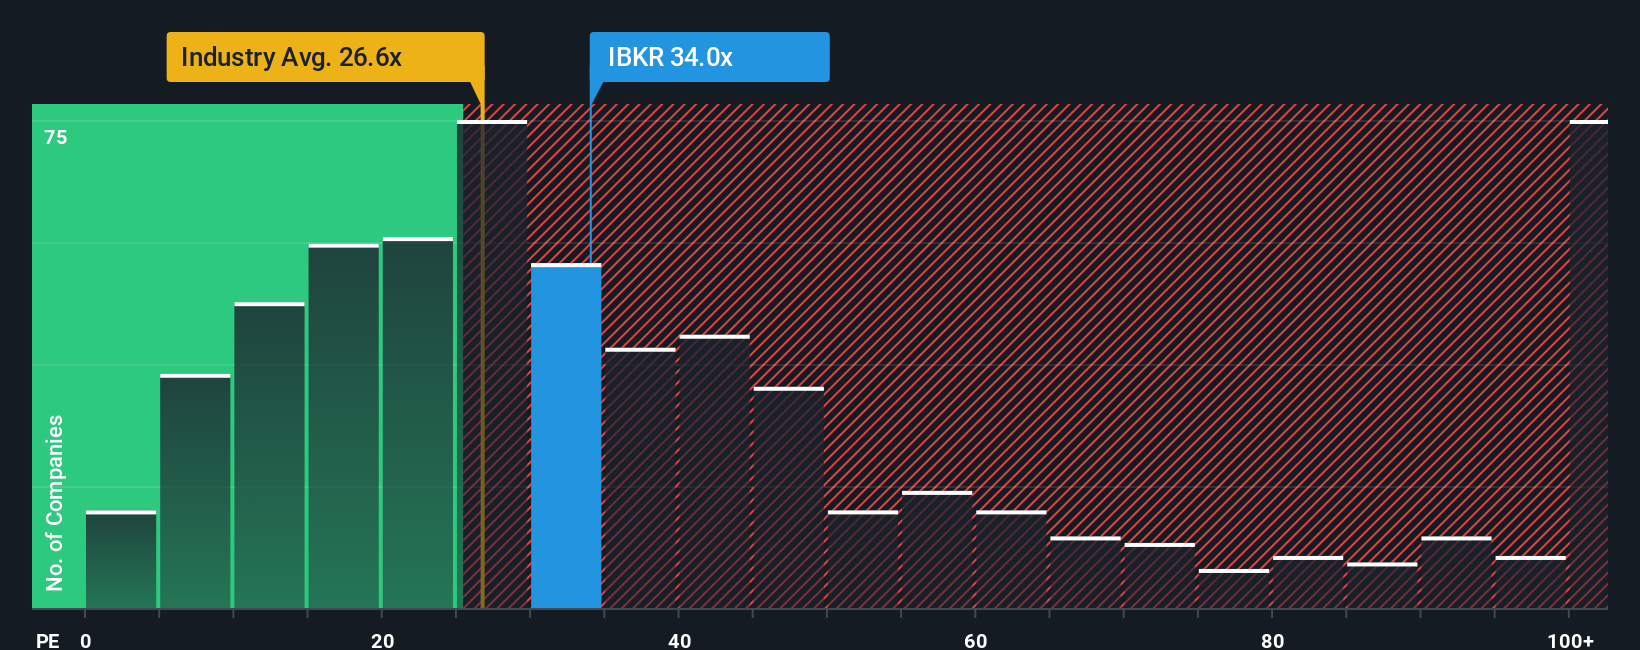
For a profitable company like Interactive Brokers Group, the P/E ratio is a useful shorthand for how much investors are paying for each dollar of earnings. It tends to reflect what the market thinks about a company’s growth prospects and risk profile, since higher expected growth or lower perceived risk often support a higher “normal” P/E, while lower growth or higher risk usually point to a lower one.
Interactive Brokers Group currently trades on a P/E of 34.65x. That sits above the Capital Markets industry average P/E of 25.77x and the peer group average of 27.21x. Simply Wall St’s proprietary Fair Ratio for Interactive Brokers Group is 21.78x, which aims to estimate a P/E that fits the company’s own characteristics, including earnings growth, margins, industry, market cap and specific risks.
The advantage of the Fair Ratio is that it adjusts for these company specific factors rather than relying on broad peer or industry comparisons, which can mask important differences. Set against this Fair Ratio, Interactive Brokers Group’s current P/E of 34.65x looks higher than what the model suggests as a reasonable level.
Result: OVERVALUED
P/E ratios tell one story, but what if the real opportunity lies elsewhere? Discover 1446 companies where insiders are betting big on explosive growth.
Upgrade Your Decision Making: Choose your Interactive Brokers Group Narrative
Earlier we mentioned that there is an even better way to understand valuation. Let us introduce you to Narratives, which let you set out your view of Interactive Brokers Group in plain language, connect that story to assumptions for revenue, earnings and margins, and then see a fair value that updates in real time on Simply Wall St’s Community page as new earnings or news arrive. This helps you compare that fair value to the current price when you are thinking about buying or selling. It can also show, for example, how one investor might build a bullish Interactive Brokers Group Narrative around technology advantages, product expansion and a fair value near US$288, while another might focus more on competition, interest rate risk and a fair value closer to US$140.
Do you think there's more to the story for Interactive Brokers Group? Head over to our Community to see what others are saying!
This article by Simply Wall St is general in nature. We provide commentary based on historical data and analyst forecasts only using an unbiased methodology and our articles are not intended to be financial advice. It does not constitute a recommendation to buy or sell any stock, and does not take account of your objectives, or your financial situation. We aim to bring you long-term focused analysis driven by fundamental data. Note that our analysis may not factor in the latest price-sensitive company announcements or qualitative material. Simply Wall St has no position in any stocks mentioned.
Have feedback on this article? Concerned about the content? Get in touch with us directly. Alternatively, email editorial-team@simplywallst.com