
 Nasdaq
 華爾街日報
華爾街日報These 4 Measures Indicate That Oki Electric Industry (TSE:6703) Is Using Debt Extensively
Howard Marks put it nicely when he said that, rather than worrying about share price volatility, 'The possibility of permanent loss is the risk I worry about... and every practical investor I know worries about.' When we think about how risky a company is, we always like to look at its use of debt, since debt overload can lead to ruin. As with many other companies Oki Electric Industry Co., Ltd. (TSE:6703) makes use of debt. But the real question is whether this debt is making the company risky.
Why Does Debt Bring Risk?
Generally speaking, debt only becomes a real problem when a company can't easily pay it off, either by raising capital or with its own cash flow. Part and parcel of capitalism is the process of 'creative destruction' where failed businesses are mercilessly liquidated by their bankers. While that is not too common, we often do see indebted companies permanently diluting shareholders because lenders force them to raise capital at a distressed price. Of course, debt can be an important tool in businesses, particularly capital heavy businesses. When we think about a company's use of debt, we first look at cash and debt together.
How Much Debt Does Oki Electric Industry Carry?
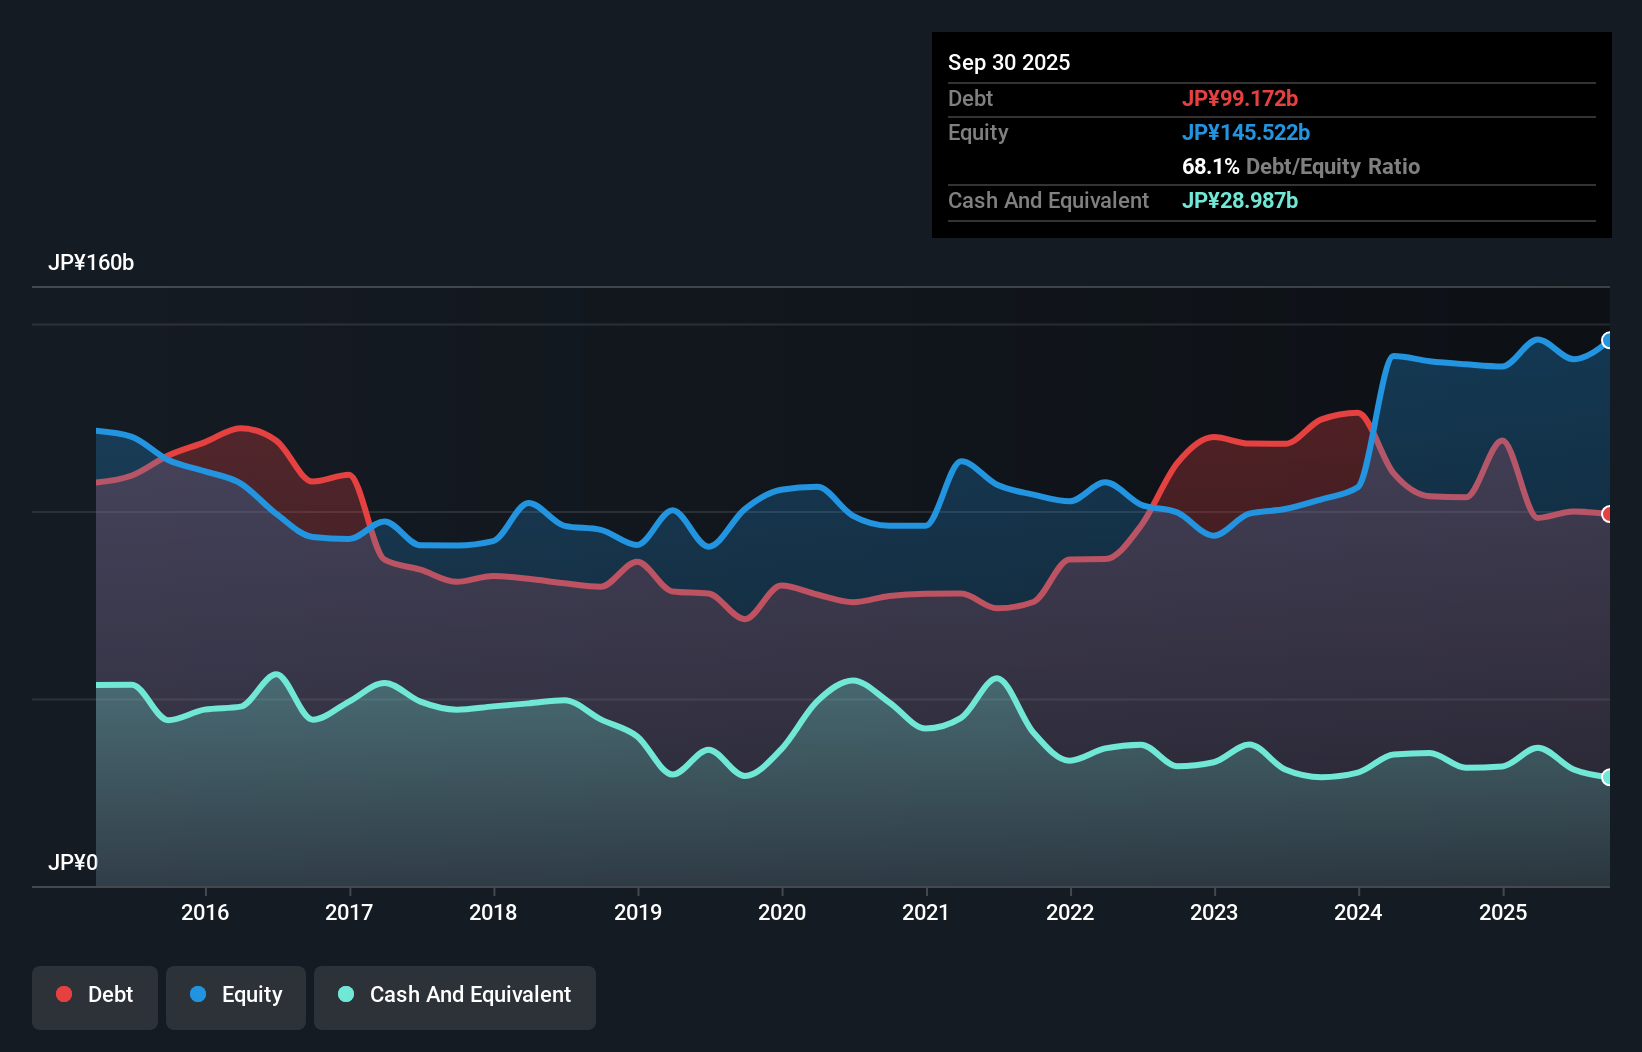
The image below, which you can click on for greater detail, shows that Oki Electric Industry had debt of JP¥99.2b at the end of September 2025, a reduction from JP¥103.6b over a year. However, because it has a cash reserve of JP¥29.0b, its net debt is less, at about JP¥70.2b.
A Look At Oki Electric Industry's Liabilities
The latest balance sheet data shows that Oki Electric Industry had liabilities of JP¥161.2b due within a year, and liabilities of JP¥86.3b falling due after that. On the other hand, it had cash of JP¥29.0b and JP¥87.5b worth of receivables due within a year. So its liabilities total JP¥131.1b more than the combination of its cash and short-term receivables.
This deficit is considerable relative to its market capitalization of JP¥180.1b, so it does suggest shareholders should keep an eye on Oki Electric Industry's use of debt. Should its lenders demand that it shore up the balance sheet, shareholders would likely face severe dilution.
View our latest analysis for Oki Electric Industry
We use two main ratios to inform us about debt levels relative to earnings. The first is net debt divided by earnings before interest, tax, depreciation, and amortization (EBITDA), while the second is how many times its earnings before interest and tax (EBIT) covers its interest expense (or its interest cover, for short). This way, we consider both the absolute quantum of the debt, as well as the interest rates paid on it.
Oki Electric Industry's net debt to EBITDA ratio of about 2.4 suggests only moderate use of debt. And its commanding EBIT of 1k times its interest expense, implies the debt load is as light as a peacock feather. Importantly, Oki Electric Industry's EBIT fell a jaw-dropping 43% in the last twelve months. If that decline continues then paying off debt will be harder than selling foie gras at a vegan convention. The balance sheet is clearly the area to focus on when you are analysing debt. But ultimately the future profitability of the business will decide if Oki Electric Industry can strengthen its balance sheet over time. So if you want to see what the professionals think, you might find this free report on analyst profit forecasts to be interesting.
Finally, a business needs free cash flow to pay off debt; accounting profits just don't cut it. So we always check how much of that EBIT is translated into free cash flow. During the last three years, Oki Electric Industry produced sturdy free cash flow equating to 60% of its EBIT, about what we'd expect. This free cash flow puts the company in a good position to pay down debt, when appropriate.
Our View
Oki Electric Industry's EBIT growth rate and level of total liabilities definitely weigh on it, in our esteem. But the good news is it seems to be able to cover its interest expense with its EBIT with ease. When we consider all the factors discussed, it seems to us that Oki Electric Industry is taking some risks with its use of debt. While that debt can boost returns, we think the company has enough leverage now. The balance sheet is clearly the area to focus on when you are analysing debt. However, not all investment risk resides within the balance sheet - far from it. For example, we've discovered 4 warning signs for Oki Electric Industry that you should be aware of before investing here.
If you're interested in investing in businesses that can grow profits without the burden of debt, then check out this free list of growing businesses that have net cash on the balance sheet.
Have feedback on this article? Concerned about the content? Get in touch with us directly. Alternatively, email editorial-team (at) simplywallst.com.
This article by Simply Wall St is general in nature. We provide commentary based on historical data and analyst forecasts only using an unbiased methodology and our articles are not intended to be financial advice. It does not constitute a recommendation to buy or sell any stock, and does not take account of your objectives, or your financial situation. We aim to bring you long-term focused analysis driven by fundamental data. Note that our analysis may not factor in the latest price-sensitive company announcements or qualitative material. Simply Wall St has no position in any stocks mentioned.