
 Nasdaq
 華爾街日報
華爾街日報Is Mosaic (MOS) Priced Attractive After Mixed Returns And Fertilizer Market Headlines
- If you are wondering whether Mosaic's current share price reflects its true worth, this article walks through what the numbers are actually saying about value.
- Mosaic's share price recently closed at US$25.30, with returns of 5.0% over the last 7 days, 7.0% over the last 30 days, 1.1% year to date, 5.7% over 1 year, and a 39.0% decline over 3 years. Together, these figures give a mixed picture of recent momentum and risk.
- Recent news around Mosaic has focused on its role in fertilizer markets and how investors are weighing commodity price trends against the company's long term positioning. This context helps explain why the share price has seen both short term gains and weaker multi year returns.
- Mosaic currently scores 5/6 on our valuation checks. Next we will look at how different valuation approaches arrive at that score, before finishing with a more practical way to think about what valuation really means for you as a shareholder.
Approach 1: Mosaic Discounted Cash Flow (DCF) Analysis
A Discounted Cash Flow, or DCF, model takes estimates of a company’s future cash flows and discounts them back to today using a required rate of return, to arrive at an estimate of what the business might be worth per share.
For Mosaic, the model used is a 2 Stage Free Cash Flow to Equity approach, based on cash flow projections in US$. The latest twelve months free cash flow is a loss of about $140.9 million. Analysts provide detailed forecasts for the earlier years, and Simply Wall St then extrapolates further out, with free cash flow projections reaching $600 million in 2030.
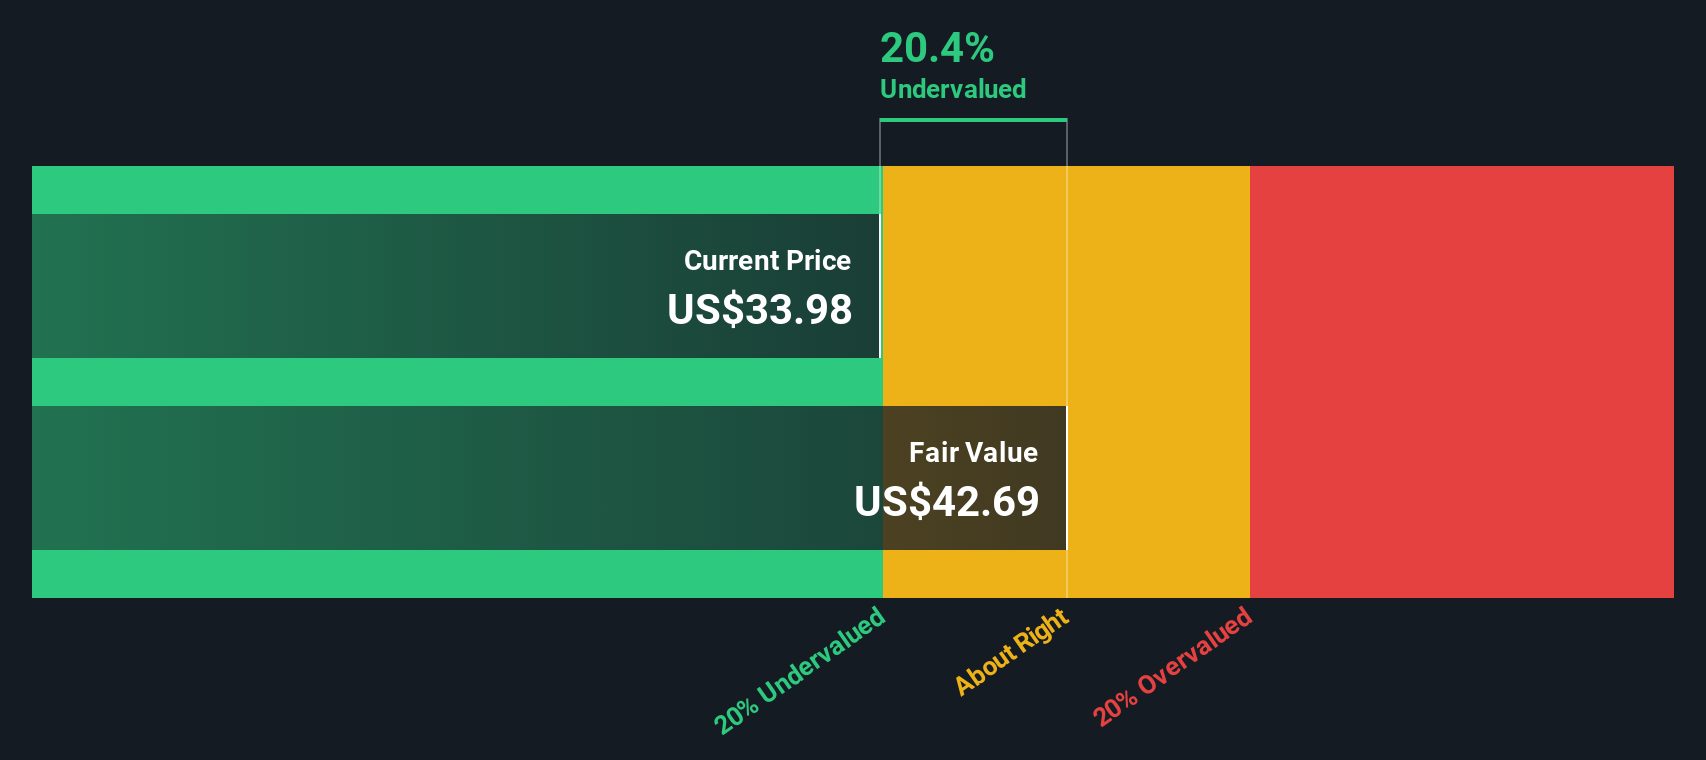
When all those projected cash flows are discounted back to today, the DCF model produces an estimated intrinsic value of about $28.84 per share, compared with the recent share price of $25.30. That gap implies the shares trade at roughly a 12.3% discount to this DCF estimate. On this specific cash flow view, Mosaic appears to be undervalued.
Result: UNDERVALUED
Our Discounted Cash Flow (DCF) analysis suggests Mosaic is undervalued by 12.3%. Track this in your watchlist or portfolio, or discover 883 more undervalued stocks based on cash flows.
Approach 2: Mosaic Price vs Earnings
For profitable companies, the P/E ratio is a useful shorthand because it ties what you pay directly to the earnings each share is generating. It also naturally reflects what the market is willing to pay for those earnings given its expectations and perceived risks.
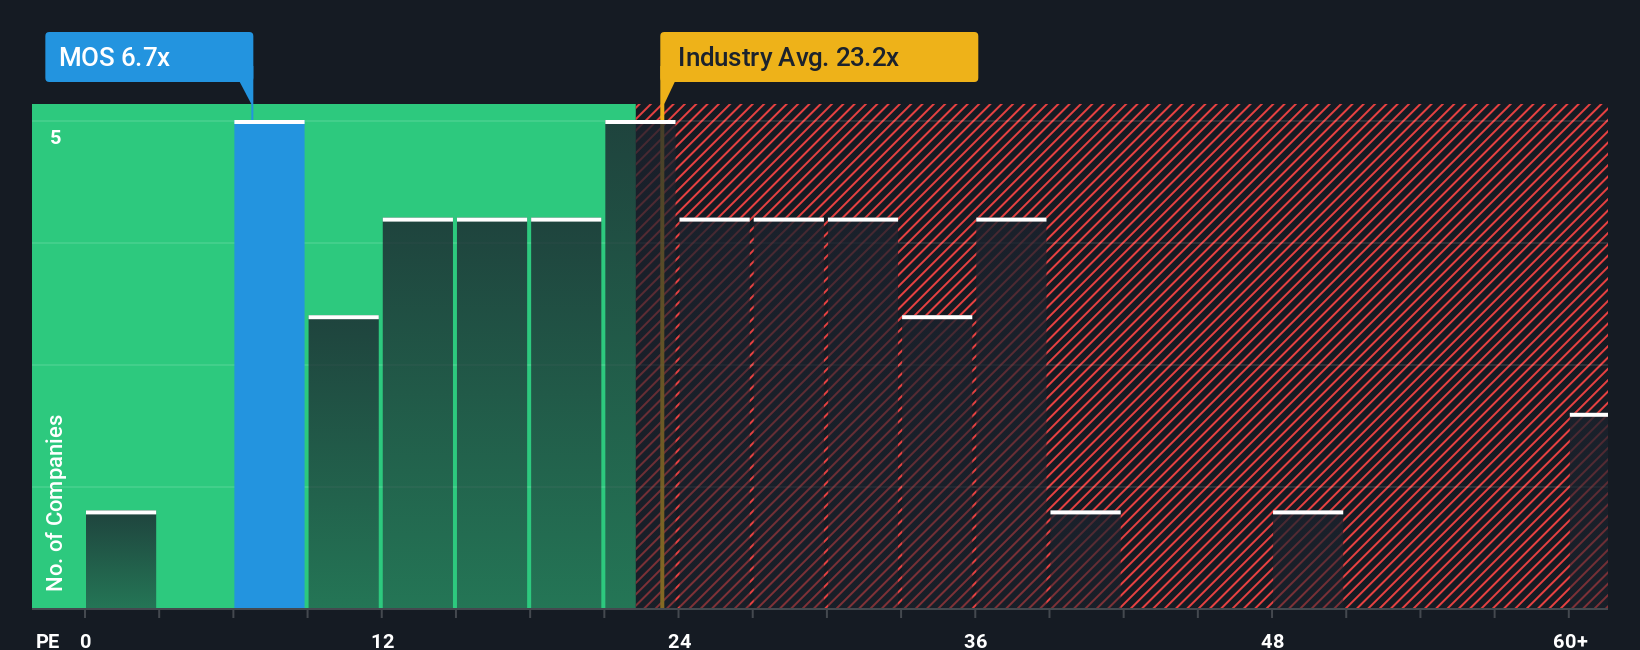
Higher growth expectations and lower perceived risk usually come with a higher “normal” or “fair” P/E, while slower growth or higher risk tend to justify a lower multiple. Mosaic currently trades on a P/E of 6.53x. That sits well below the Chemicals industry average P/E of 25.05x and also below the peer group average of 15.16x. This suggests the market is assigning a lower multiple to Mosaic’s earnings than to many of its peers.
Simply Wall St’s Fair Ratio for Mosaic is 13.24x. This is a proprietary estimate of what P/E might be reasonable given factors such as earnings growth, profit margins, industry, market cap and specific risks. Because it incorporates these elements, the Fair Ratio can be more tailored than a simple comparison to industry or peer averages. With Mosaic’s current P/E of 6.53x sitting below the Fair Ratio of 13.24x, the shares screen as undervalued on this earnings multiple view.
Result: UNDERVALUED
P/E ratios tell one story, but what if the real opportunity lies elsewhere? Discover 1446 companies where insiders are betting big on explosive growth.
Upgrade Your Decision Making: Choose your Mosaic Narrative
Earlier we mentioned that there is an even better way to understand valuation. Let us introduce you to Narratives, a feature on Simply Wall St’s Community page that lets you attach a clear story to your assumptions for Mosaic’s future revenue, earnings and margins. You can link that story to a financial forecast and a Fair Value, and then compare that Fair Value with the current share price to decide whether Mosaic looks attractive to you right now. Narratives automatically update when new earnings or news arrive and allow different investors to hold very different, but clearly framed, views. For example, one Narrative might use the higher analyst estimates for earnings and a Fair Value near the upper end of analyst targets around US$49.00, while another might use the lower earnings assumptions with a Fair Value closer to the low end around US$33.00.
Do you think there's more to the story for Mosaic? Head over to our Community to see what others are saying!

This article by Simply Wall St is general in nature. We provide commentary based on historical data and analyst forecasts only using an unbiased methodology and our articles are not intended to be financial advice. It does not constitute a recommendation to buy or sell any stock, and does not take account of your objectives, or your financial situation. We aim to bring you long-term focused analysis driven by fundamental data. Note that our analysis may not factor in the latest price-sensitive company announcements or qualitative material. Simply Wall St has no position in any stocks mentioned.
Have feedback on this article? Concerned about the content? Get in touch with us directly. Alternatively, email editorial-team@simplywallst.com