
 Nasdaq
 華爾街日報
華爾街日報Has The Market Fully Reflected Exelixis (EXEL) After Its Strong Multi‑Year Share Price Run?
- Wondering if Exelixis at a last close of US$46.19 still offers value, or if the easy money has already been made? This article walks through what the numbers are actually saying about the stock.
- Over the shorter term, Exelixis has posted returns of 5.4% over 7 days, 9.5% over 30 days, 6.0% year to date, 33.9% over 1 year and 175.1% over 3 years. Its 5 year return of 89.5% gives a broader context to the recent share price move.
- Recent coverage around Exelixis has focused on its position in the US biotechnology space and how investors are thinking about its product portfolio and pipeline. That backdrop helps frame why the share price performance across multiple time frames is attracting fresh attention from both new and existing shareholders.
- On our valuation checks, Exelixis has a score of 5/6. This sets up a closer look at how different methods like DCF, multiples and peer comparisons line up, and whether there is an even more complete way to think about what the stock might be worth by the end of this article.
Approach 1: Exelixis Discounted Cash Flow (DCF) Analysis
The Discounted Cash Flow model estimates what a company could be worth today by projecting its future cash flows and then discounting those back into present dollars.
For Exelixis, the model used is a 2 Stage Free Cash Flow to Equity approach. The latest twelve month Free Cash Flow (FCF) is about $651.6 million. Analyst-based and extrapolated projections suggest FCF rising to $2,041.7 million by 2030, with interim estimates such as $803.7 million for 2026 and $1,013.5 million for 2027, all in dollar terms and then discounted to today.
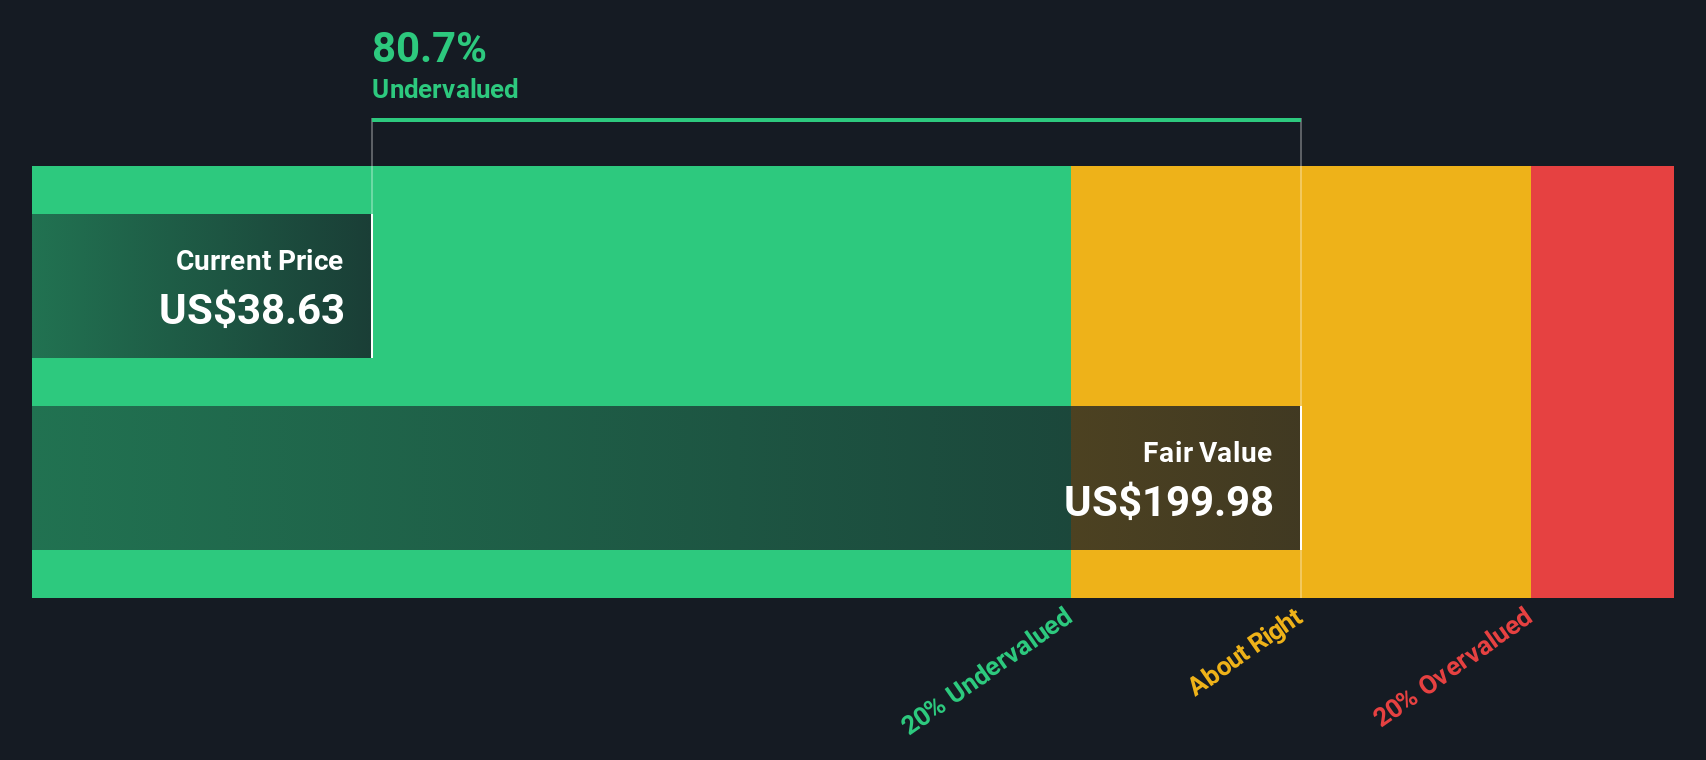
When those projected cash flows from 2026 through 2035 are discounted, the model arrives at an estimated intrinsic value of about $214.52 per share for Exelixis. Compared with the recent share price of $46.19, this DCF output indicates the stock is about 78.5% undervalued on these assumptions.
Result: UNDERVALUED
Our Discounted Cash Flow (DCF) analysis suggests Exelixis is undervalued by 78.5%. Track this in your watchlist or portfolio, or discover 880 more undervalued stocks based on cash flows.
Approach 2: Exelixis Price vs Earnings
For a profitable company like Exelixis, the P/E ratio is a useful way to link what you pay per share to the earnings that each share generates. Investors usually accept a higher P/E when they expect stronger growth or see the earnings stream as relatively resilient, and a lower P/E when growth is more modest or the risk profile is higher.
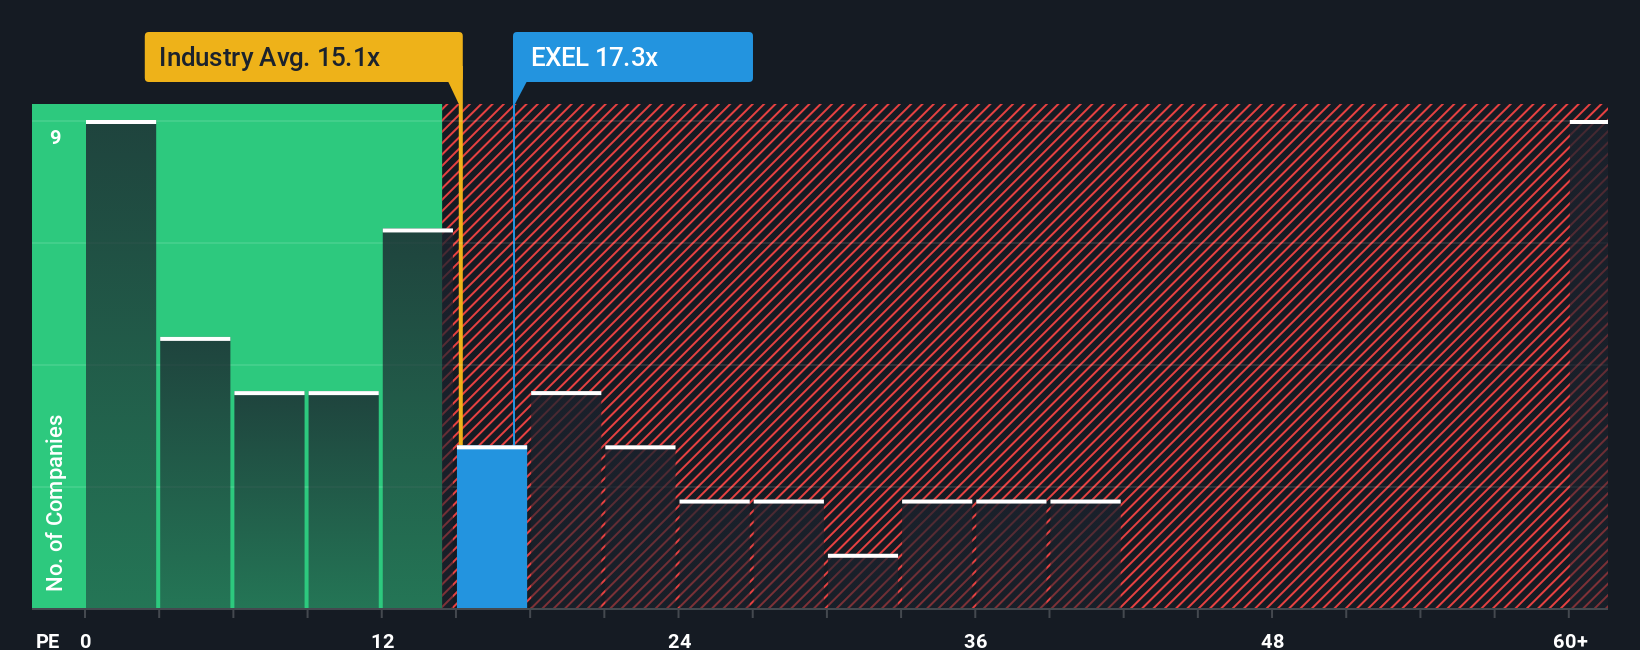
Exelixis currently trades on a P/E of 18.34x. That sits below the Biotechs industry average P/E of about 22.01x and also below the peer group average of 22.12x. Simply Wall St’s Fair Ratio for Exelixis is 23.49x, which represents the P/E that its model suggests could be reasonable given factors such as earnings growth, profit margins, industry, market cap and company specific risks.
The Fair Ratio is more tailored than a simple comparison with peers or the broad industry. It adjusts for Exelixis’ own characteristics rather than assuming that every biotech deserves the same multiple. Comparing the Fair Ratio of 23.49x with the current P/E of 18.34x indicates that the shares trade at a discount relative to that company specific view.
Result: UNDERVALUED
P/E ratios tell one story, but what if the real opportunity lies elsewhere? Discover 1443 companies where insiders are betting big on explosive growth.
Upgrade Your Decision Making: Choose your Exelixis Narrative
Earlier we mentioned that there is an even better way to understand valuation. Let us introduce Narratives, which simply means you write the story you believe about Exelixis, link that story to your own assumptions for future revenue, earnings and margins, and the Simply Wall St platform on the Community page turns it into a forecast and a Fair Value. You can then compare this with the current price to help decide if and when you might buy or sell. Each Narrative updates automatically as new news or earnings come in. A more optimistic investor might plug in assumptions closer to the higher analyst earnings and price targets, while a more cautious investor might anchor to the lower earnings and price targets. Both can clearly see how their different views flow through to different Fair Values without needing to build a full model from scratch.
Do you think there's more to the story for Exelixis? Head over to our Community to see what others are saying!

This article by Simply Wall St is general in nature. We provide commentary based on historical data and analyst forecasts only using an unbiased methodology and our articles are not intended to be financial advice. It does not constitute a recommendation to buy or sell any stock, and does not take account of your objectives, or your financial situation. We aim to bring you long-term focused analysis driven by fundamental data. Note that our analysis may not factor in the latest price-sensitive company announcements or qualitative material. Simply Wall St has no position in any stocks mentioned.
Have feedback on this article? Concerned about the content? Get in touch with us directly. Alternatively, email editorial-team@simplywallst.com