
 Nasdaq
 華爾街日報
華爾街日報Is Six Flags Entertainment (FUN) Offering An Opening After A 68% One Year Share Price Slide
- If you are wondering whether Six Flags Entertainment is a bargain or a value trap at its current share price, you are not alone.
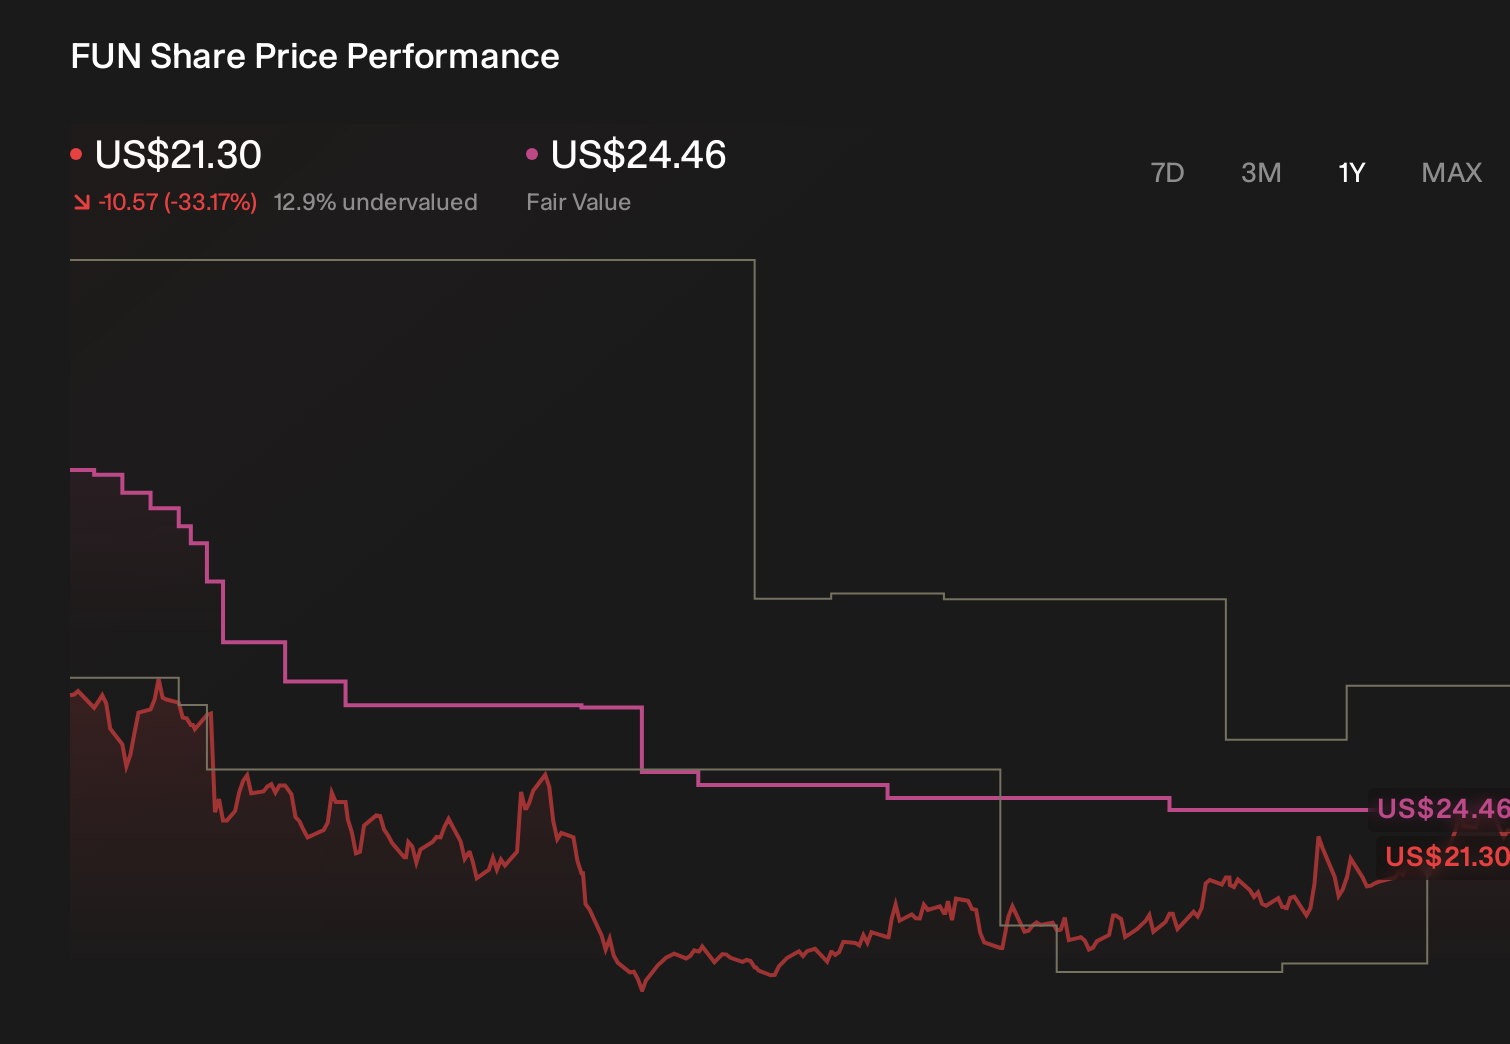
- The stock last closed at US$15.10, with returns of a 1.6% decline over 7 days, 3.3% over 30 days, a 2.5% decline year to date, and a 67.9% decline over 1 year, a 62.9% decline over 3 years, and a 61.8% decline over 5 years.
- Recent coverage has focused on how Six Flags Entertainment fits into broader discussions about theme park operators and consumer services stocks, with attention on how investors are reassessing risk and potential value. Commentary has also highlighted how sentiment toward leisure and entertainment names can shift quickly when expectations around attendance, spending, or capital allocation change.
- Simply Wall St currently gives Six Flags Entertainment a valuation score of 5 out of 6, which we will unpack using different methods, before finishing with a perspective that can help you make sense of all those valuation numbers in a more practical way.
Find out why Six Flags Entertainment's -67.9% return over the last year is lagging behind its peers.
Approach 1: Six Flags Entertainment Discounted Cash Flow (DCF) Analysis
A Discounted Cash Flow, or DCF, model takes estimates of a company’s future cash flows and discounts them back to today using a required return, to arrive at an estimate of what the business might be worth per share.
For Six Flags Entertainment, Simply Wall St applies a 2 Stage Free Cash Flow to Equity model using $ free cash flow. The latest twelve month free cash flow is a loss of about $93.6 million. Looking ahead, analysts and extrapolated estimates point to free cash flow of $547 million in 2029, with intermediate projections such as $269 million in 2026 and $325 million in 2027, all expressed in today’s money through discounting.
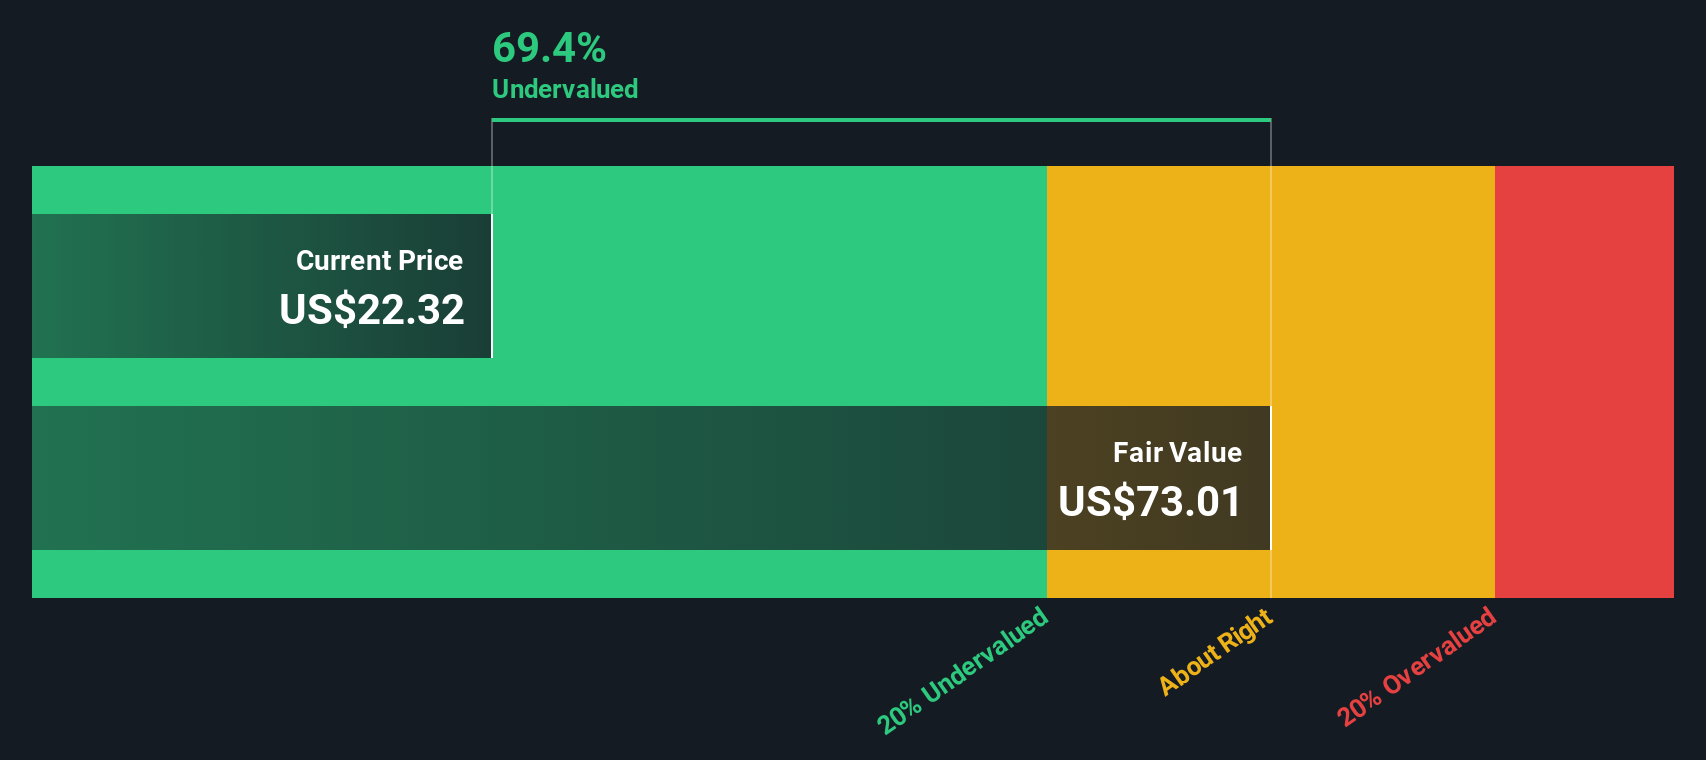
Aggregating these discounted cash flows produces an estimated intrinsic value of about $58.50 per share. Compared with the recent share price of US$15.10, this implies the stock screens as about 74.2% undervalued on this DCF framework.
Result: UNDERVALUED
Our Discounted Cash Flow (DCF) analysis suggests Six Flags Entertainment is undervalued by 74.2%. Track this in your watchlist or portfolio, or discover 884 more undervalued stocks based on cash flows.
Approach 2: Six Flags Entertainment Price vs Sales
For companies where earnings are uneven or less informative, the P/S ratio can be a useful way to compare what investors are paying for each dollar of revenue. It sidesteps short term swings in profit and focuses on the top line, which can be helpful for businesses in cyclical or capital intensive sectors.
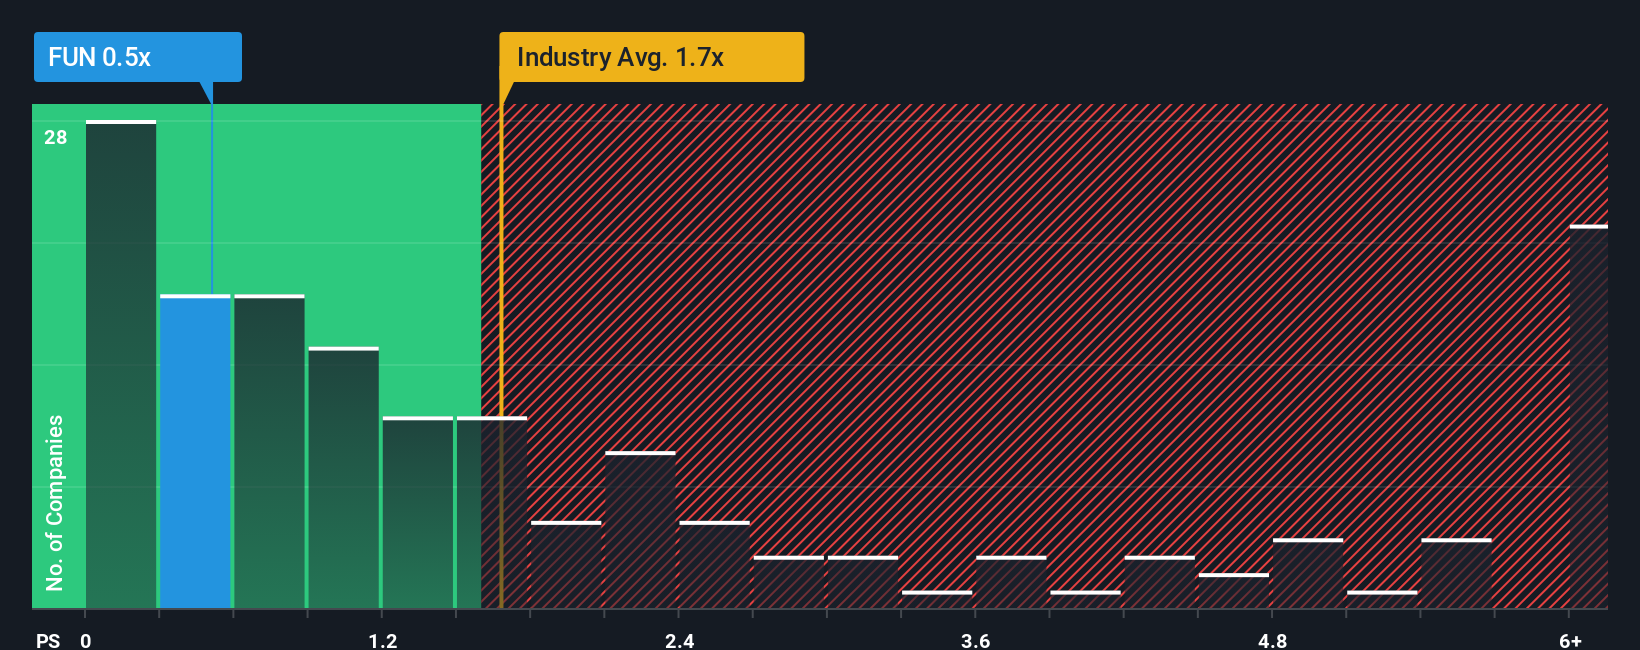
In general, higher growth expectations and lower perceived risk can support a higher “normal” P/S multiple, while slower growth or higher risk usually justifies a lower one. Six Flags Entertainment currently trades on a P/S ratio of 0.49x. That sits below the Hospitality industry average of 1.66x and also below the peer average of 1.13x.
Simply Wall St’s Fair Ratio for Six Flags Entertainment is 0.91x. This is a proprietary estimate of what a reasonable P/S might be given the company’s earnings growth profile, industry, profit margins, market cap and risk characteristics. Compared with a simple industry or peer comparison, the Fair Ratio aims to be more tailored to the company’s own fundamentals. With the current P/S of 0.49x sitting below the Fair Ratio of 0.91x, the shares screen as undervalued on this metric.
Result: UNDERVALUED
P/S ratios tell one story, but what if the real opportunity lies elsewhere? Discover 1444 companies where insiders are betting big on explosive growth.
Upgrade Your Decision Making: Choose your Six Flags Entertainment Narrative
Earlier we mentioned that there is an even better way to understand valuation. On Simply Wall St’s Community page you can now use Narratives, where you and other investors can connect a clear story about Six Flags Entertainment to specific forecasts for revenue, earnings and margins. You can then link that forecast to a Fair Value and compare it with the current price to help decide whether to buy or sell. You can also see that Fair Value update automatically as new information like activist campaigns, leadership changes or earnings hits the platform. This is why one investor might build a bullish Six Flags Entertainment Narrative around higher earnings of up to $321 million and a higher fair value, while another might focus on risks, use earnings closer to $160.2 million and arrive at a lower fair value instead.
Do you think there's more to the story for Six Flags Entertainment? Head over to our Community to see what others are saying!
This article by Simply Wall St is general in nature. We provide commentary based on historical data and analyst forecasts only using an unbiased methodology and our articles are not intended to be financial advice. It does not constitute a recommendation to buy or sell any stock, and does not take account of your objectives, or your financial situation. We aim to bring you long-term focused analysis driven by fundamental data. Note that our analysis may not factor in the latest price-sensitive company announcements or qualitative material. Simply Wall St has no position in any stocks mentioned.
Have feedback on this article? Concerned about the content? Get in touch with us directly. Alternatively, email editorial-team@simplywallst.com