
 Nasdaq
 華爾街日報
華爾街日報Is Celldex Therapeutics (CLDX) Pricing Reflect Its DCF Upside After Recent Share Swings
- If you are wondering whether Celldex Therapeutics at around US$27.76 is priced attractively or not, you are in the right place to size up what the current market tag might be telling you.
- The stock has had mixed returns, with a 2.2% gain over the last 7 days, a 6.8% decline over 30 days, a 2.8% gain year to date, a 4.6% gain over 1 year, a 40.2% decline over 3 years and a 58.1% gain over 5 years, which can influence how investors think about both potential and risk.
- Recent attention around Celldex Therapeutics has centered on its position in the pharmaceuticals and biotech space and how its pipeline and trial progress fit into investor expectations. This context helps frame why the share price has seen periods of pressure alongside signs of renewed interest over different time frames.
- Right now, Celldex Therapeutics has a valuation score of 3 out of 6, which means it screens as undervalued on half of the valuation checks we use. Next, we will walk through the key valuation approaches that feed into this score and finish with a more rounded way to think about what the market is really pricing in.
Find out why Celldex Therapeutics's 4.6% return over the last year is lagging behind its peers.
Approach 1: Celldex Therapeutics Discounted Cash Flow (DCF) Analysis
A Discounted Cash Flow, or DCF, model projects a company’s future cash flows and then discounts them back to today’s value to estimate what the business could be worth per share.
For Celldex Therapeutics, the model used is a 2 Stage Free Cash Flow to Equity approach. The latest twelve month free cash flow stands at a loss of about US$180.3 million. Analyst estimates and subsequent extrapolations suggest free cash flow remains negative through to 2029, then turns positive, with projected free cash flow of US$103.3 million in 2030. Beyond the explicit analyst window, Simply Wall St extrapolates additional free cash flow figures through 2035 using its methodology.
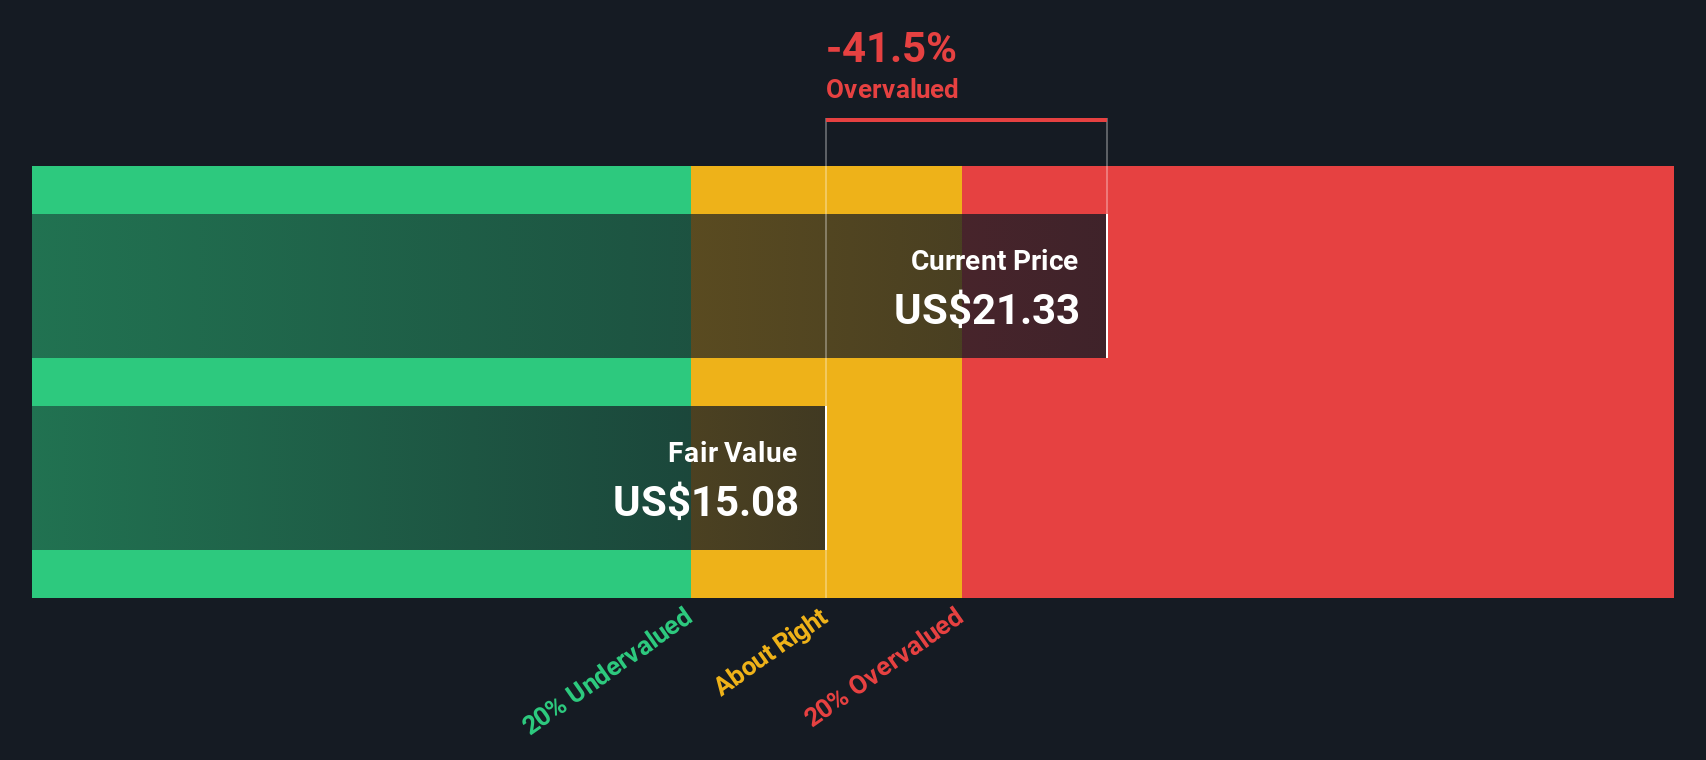
When all of these projected cash flows are discounted back using the DCF model, the estimated intrinsic value is about US$84.97 per share. Compared with the recent share price of roughly US$27.76, this indicates the market price is about 67.3% below the DCF estimate, so the model views Celldex as undervalued on this basis.
Result: UNDERVALUED
Our Discounted Cash Flow (DCF) analysis suggests Celldex Therapeutics is undervalued by 67.3%. Track this in your watchlist or portfolio, or discover 884 more undervalued stocks based on cash flows.
Approach 2: Celldex Therapeutics Price vs Book
For companies that are not yet generating consistent earnings, or where revenues do not reflect the underlying assets, the price to book (P/B) ratio can be a useful way to think about value because it compares the share price with the accounting value of net assets.
What counts as a reasonable P/B often reflects what investors expect for future growth and how much risk they see in the business. Higher expected growth or lower perceived risk can justify a higher multiple, while more uncertainty or weaker growth expectations usually point to a lower one.
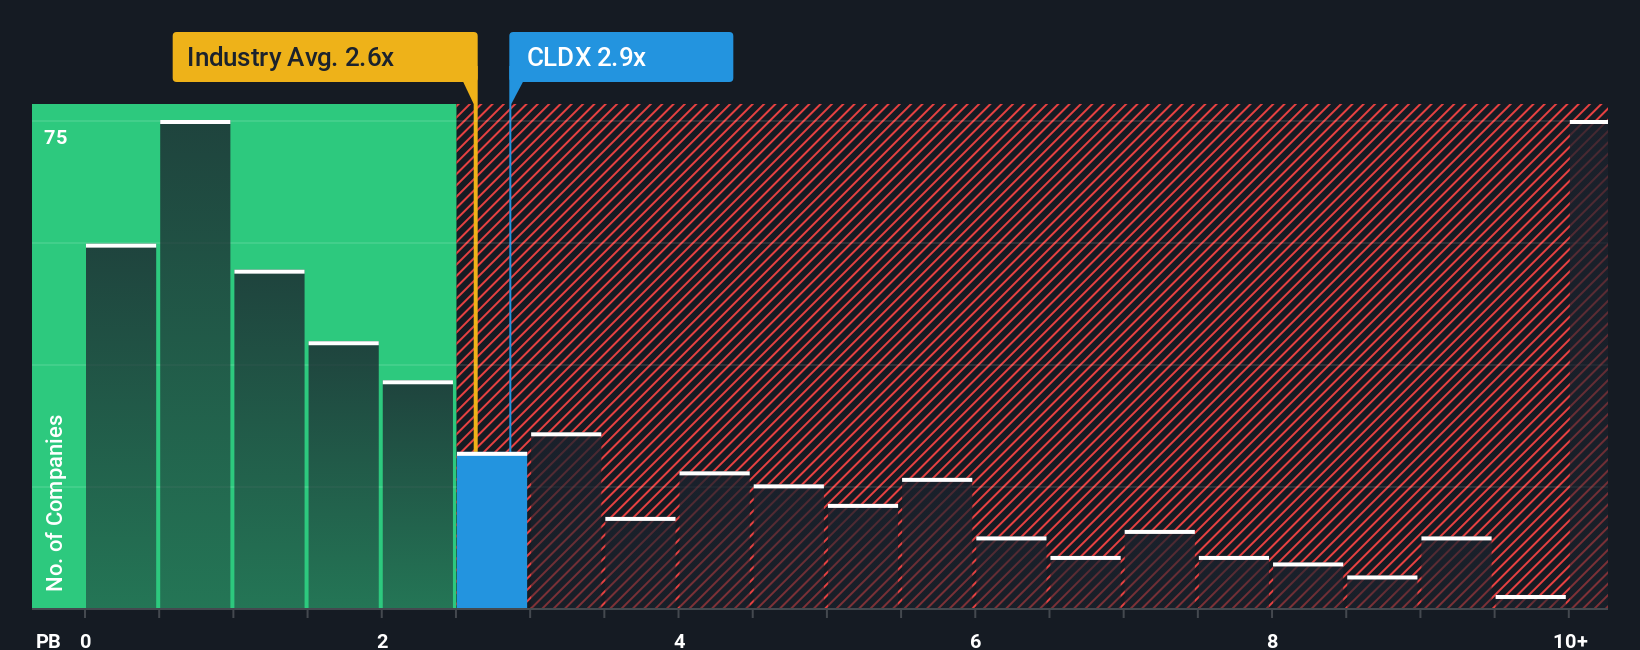
Celldex Therapeutics currently trades on a P/B of about 3.08x. That sits above the Biotechs industry average of about 2.75x, but below the peer group average of roughly 4.47x. Simply Wall St also uses a proprietary “Fair Ratio” for P/B, which estimates the multiple you might expect given factors such as earnings growth, profit margins, industry, market cap and company specific risks.
This Fair Ratio framework can be more informative than a simple comparison with peers or the industry because it adjusts for the company’s own profile rather than assuming all biotechs should trade on the same benchmark multiple. In this case, the Fair Ratio is not available, so it is not possible to say whether the current 3.08x points to under or overvaluation based on that model.
Result: ABOUT RIGHT
P/B ratios tell one story, but what if the real opportunity lies elsewhere? Discover 1443 companies where insiders are betting big on explosive growth.
Upgrade Your Decision Making: Choose your Celldex Therapeutics Narrative
Earlier we mentioned that there is an even better way to understand valuation, so let us introduce you to Narratives, which are clear, written stories that sit behind your numbers such as fair value, and your own estimates for future revenue, earnings and margins.
A Narrative ties together what you believe about Celldex Therapeutics, for example its drug pipeline or trial milestones, with a financial forecast and then a fair value that you can compare directly with today’s share price.
On Simply Wall St, Narratives sit inside the Community page. Millions of investors use them as an easy tool to decide whether to hold, reduce or add to a position by seeing how their Fair Value view stacks up against the current market Price. These Narratives automatically refresh when new information such as earnings reports or news headlines is added to the platform.
For Celldex Therapeutics, one investor might build a Narrative that assumes a relatively high fair value based on stronger future cash flows. Another investor might use more cautious assumptions that lead to a much lower fair value, which shows how the same stock can look very different depending on the story and numbers you choose.
Do you think there's more to the story for Celldex Therapeutics? Head over to our Community to see what others are saying!

This article by Simply Wall St is general in nature. We provide commentary based on historical data and analyst forecasts only using an unbiased methodology and our articles are not intended to be financial advice. It does not constitute a recommendation to buy or sell any stock, and does not take account of your objectives, or your financial situation. We aim to bring you long-term focused analysis driven by fundamental data. Note that our analysis may not factor in the latest price-sensitive company announcements or qualitative material. Simply Wall St has no position in any stocks mentioned.
Have feedback on this article? Concerned about the content? Get in touch with us directly. Alternatively, email editorial-team@simplywallst.com