
 Nasdaq
 華爾街日報
華爾街日報Is It Too Late To Revisit Ducommun (DCO) After Its Strong 1 Year Share Price Run?
- Wondering if Ducommun at about US$100 a share still offers value, or if most of the easy gains are already on the table? This article is built to help you frame that question clearly.
- The stock recently closed at US$100.04, with returns of 5.2% over 7 days, 11.1% over 30 days, 3.3% year to date, 54.0% over 1 year, 78.1% over 3 years and 79.1% over 5 years, which indicates that many investors are already paying close attention.
- Recent coverage around Ducommun has highlighted the company as one investors are revisiting for its positioning in capital goods and its longer term share price record. This broader interest helps explain why the stock's performance profile is attracting fresh valuation questions today.
- On our checklist of six valuation tests, Ducommun scores 4/6, as shown by our valuation score. Next we will walk through the key valuation approaches behind that, before finishing with a more practical way to think about what the current price offers you.
Find out why Ducommun's 54.0% return over the last year is lagging behind its peers.
Approach 1: Ducommun Discounted Cash Flow (DCF) Analysis
A Discounted Cash Flow model takes estimates of a company’s future cash flows and discounts them back to today’s value, so you can compare that figure to the current share price.
For Ducommun, the latest twelve month Free Cash Flow is about $42.4 million. Using a 2 Stage Free Cash Flow to Equity model, analysts have provided explicit forecasts that extend out to a projected Free Cash Flow of $84.5 million in 2027, with further annual figures out to 2035 extrapolated from those estimates by Simply Wall St.
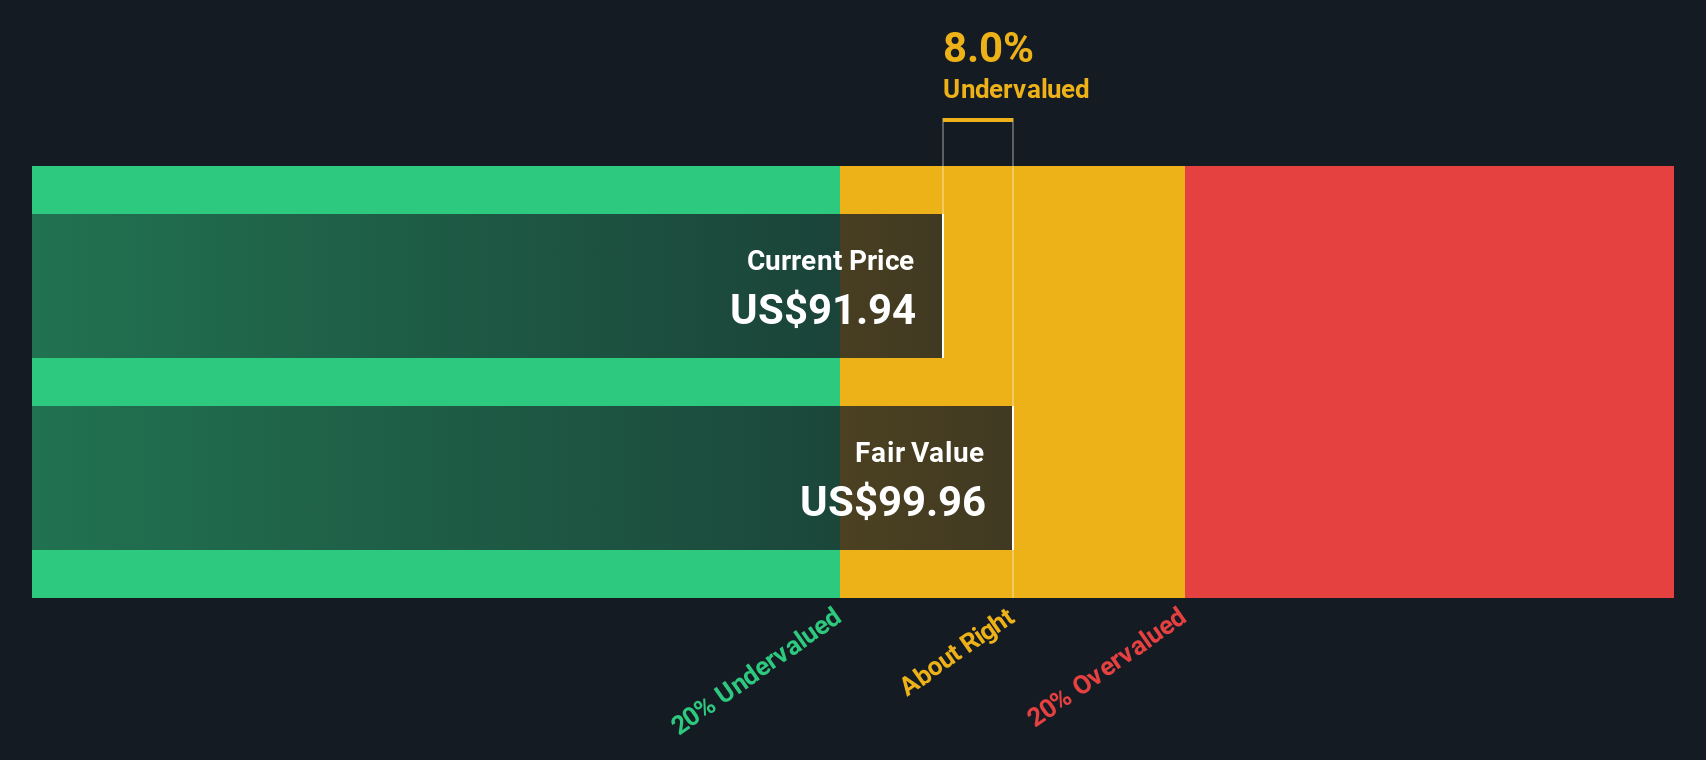
When those projected cash flows are discounted back to today in US$, the model arrives at an estimated intrinsic value of about $152.58 per share. Compared with the recent share price of around $100, this implies Ducommun trades at roughly a 34.4% discount to that DCF estimate, which points to the shares being undervalued on this specific cash flow framework.
Result: UNDERVALUED
Our Discounted Cash Flow (DCF) analysis suggests Ducommun is undervalued by 34.4%. Track this in your watchlist or portfolio, or discover 886 more undervalued stocks based on cash flows.
Approach 2: Ducommun Price vs Sales
For companies where earnings can be volatile, the P/S ratio is often a useful cross check because it compares the share price to the revenue that the business is generating, regardless of short term profit swings.
In general, investors tend to accept a higher or lower P/S based on what they expect for future growth and how much risk they see in the business. Higher expected growth or lower perceived risk can justify a richer multiple, while lower growth expectations or higher risk usually point to a more modest ratio.
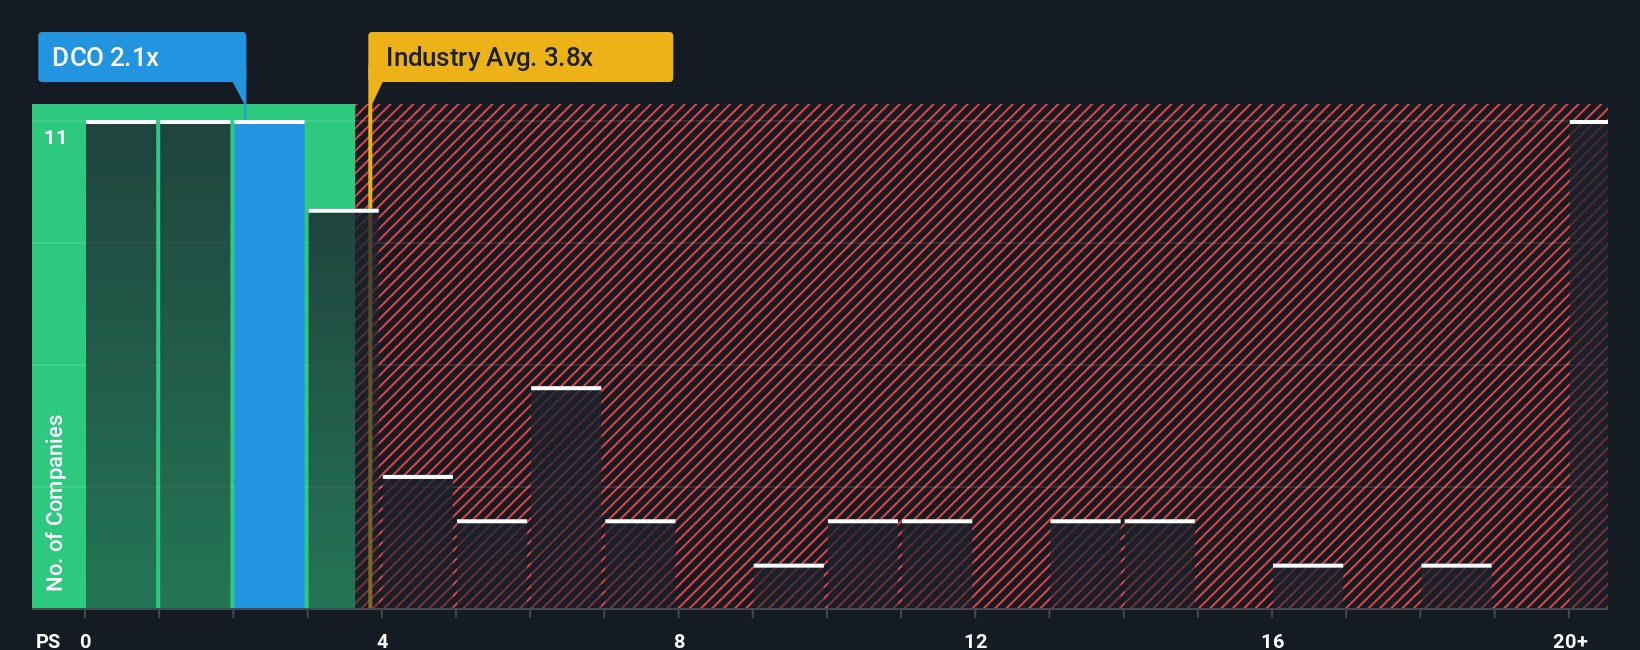
Ducommun currently trades on a P/S of 1.85x, compared with the Aerospace & Defense industry average of 3.71x and a peer group average of 4.97x. Simply Wall St’s Fair Ratio for Ducommun is 1.03x, which is its proprietary estimate of what a “normal” P/S might be after considering factors such as earnings growth, profit margins, market cap, risk profile and the company’s industry.
Because the Fair Ratio is tailored to Ducommun’s specific characteristics, it can be more useful than relying only on broad industry or peer comparisons. On this measure, the current 1.85x P/S sits above the 1.03x Fair Ratio, which indicates that the shares may be trading at a relatively higher level on this metric.
Result: OVERVALUED
P/S ratios tell one story, but what if the real opportunity lies elsewhere? Discover 1443 companies where insiders are betting big on explosive growth.
Upgrade Your Decision Making: Choose your Ducommun Narrative
Earlier we mentioned that there is an even better way to understand valuation, so let us introduce you to Narratives. These are simply your story about Ducommun, linked to a financial forecast and then to a fair value. All of this is captured on Simply Wall St’s Community page, where millions of investors share how their assumptions on future revenue, earnings, margins and a fair value compare with the current price. The page is updated automatically as new news or earnings arrive. For example, one investor might build a more optimistic Ducommun Narrative that leans on higher defense and commercial aerospace demand, improving margins and a fair value closer to the US$106.25 analyst consensus. Another might focus more on exposure to volatile aerospace customers, defense budget risk and execution challenges around facility consolidation and acquisitions, leading them to a lower fair value. Each Narrative gives you a clear, easy framework for deciding whether today’s price makes sense for your own view.
Do you think there's more to the story for Ducommun? Head over to our Community to see what others are saying!

This article by Simply Wall St is general in nature. We provide commentary based on historical data and analyst forecasts only using an unbiased methodology and our articles are not intended to be financial advice. It does not constitute a recommendation to buy or sell any stock, and does not take account of your objectives, or your financial situation. We aim to bring you long-term focused analysis driven by fundamental data. Note that our analysis may not factor in the latest price-sensitive company announcements or qualitative material. Simply Wall St has no position in any stocks mentioned.
Have feedback on this article? Concerned about the content? Get in touch with us directly. Alternatively, email editorial-team@simplywallst.com