
 Nasdaq
 華爾街日報
華爾街日報3 European Penny Stocks With Market Caps Under €20M
As the European markets continue to thrive, with the STOXX Europe 600 Index reaching new highs and closing out 2025 with its strongest performance since 2021, investors are increasingly looking towards smaller opportunities that might have been overlooked. Penny stocks, a term that may seem outdated, still hold relevance for those seeking growth potential at lower price points. These stocks often represent smaller or newer companies that can offer significant upside when supported by strong financials and fundamentals.
Top 10 Penny Stocks In Europe
| Name | Share Price | Market Cap | Rewards & Risks |
| Ariston Holding (BIT:ARIS) | €4.384 | €1.52B | ✅ 4 ⚠️ 3 View Analysis > |
| Orthex Oyj (HLSE:ORTHEX) | €4.90 | €87.02M | ✅ 4 ⚠️ 0 View Analysis > |
| Lucisano Media Group (BIT:LMG) | €1.04 | €15.45M | ✅ 4 ⚠️ 5 View Analysis > |
| Angler Gaming (NGM:ANGL) | SEK3.60 | SEK269.95M | ✅ 4 ⚠️ 2 View Analysis > |
| Angler Gaming (DB:0QM) | €0.31 | €226.45M | ✅ 3 ⚠️ 3 View Analysis > |
| Libertas 7 (BME:LIB) | €3.10 | €65.75M | ✅ 3 ⚠️ 3 View Analysis > |
| Hultstrom Group (OM:HULT B) | SEK3.22 | SEK195.9M | ✅ 2 ⚠️ 2 View Analysis > |
| ForFarmers (ENXTAM:FFARM) | €4.65 | €410.99M | ✅ 4 ⚠️ 1 View Analysis > |
| Deceuninck (ENXTBR:DECB) | €2.255 | €311.69M | ✅ 4 ⚠️ 1 View Analysis > |
| Dovre Group (HLSE:DOV1V) | €0.0726 | €7.89M | ✅ 2 ⚠️ 3 View Analysis > |
Click here to see the full list of 285 stocks from our European Penny Stocks screener.
Let's dive into some prime choices out of the screener.
Maps (BIT:MAPS)
Simply Wall St Financial Health Rating: ★★★★★★
Overview: Maps S.p.A. is a software solution provider that designs and develops technological solutions to aid decision-making processes in public and private sectors, with a market cap of €41.04 million.
Operations: Maps S.p.A. has not reported any specific revenue segments.
Market Cap: €41.04M
Maps S.p.A., with a market cap of €41.04 million, has shown promising financial metrics for a penny stock. Its earnings grew by 64.3% last year, surpassing the software industry's growth rate, and its net profit margins have improved to 6%. The company's debt management is commendable, with a reduced debt-to-equity ratio and satisfactory coverage by operating cash flow. Trading at 43.2% below estimated fair value suggests potential undervaluation, while analysts agree on a significant upside in stock price forecasts. However, its return on equity remains low at 7.1%, indicating room for improvement in profitability efficiency.
- Unlock comprehensive insights into our analysis of Maps stock in this financial health report.
- Gain insights into Maps' outlook and expected performance with our report on the company's earnings estimates.
Flexion Mobile (OM:FLEXM)
Simply Wall St Financial Health Rating: ★★★★★★
Overview: Flexion Mobile Plc operates a game distribution platform for game developers worldwide and has a market cap of SEK164.36 million.
Operations: The company generates revenue primarily from the distribution of games, amounting to £73.56 million.
Market Cap: SEK164.36M
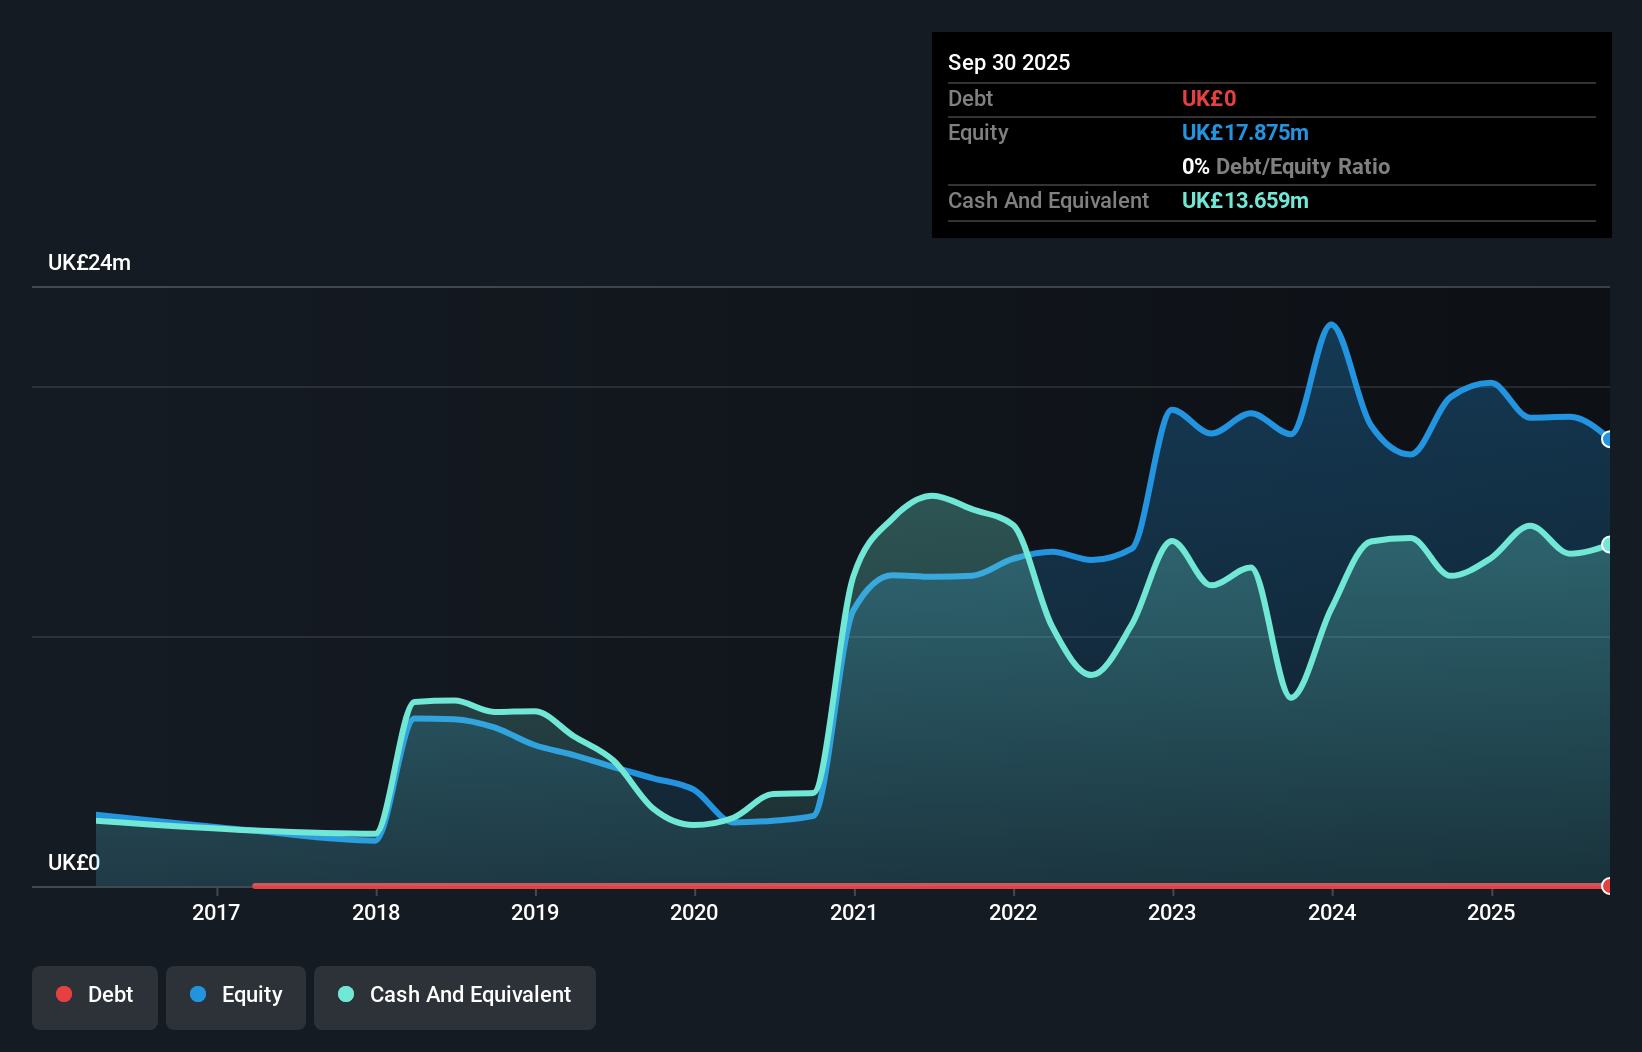
Flexion Mobile Plc, with a market cap of SEK164.36 million, operates a game distribution platform and reported £73.56 million in revenue. Despite being unprofitable with a negative return on equity of -14.66%, it remains debt-free and has sufficient cash runway for over three years due to positive free cash flow growth. Recent earnings showed reduced net losses compared to the previous year, indicating some financial improvement. A strategic partnership with Xsolla aims to expand developer reach into alternative markets, potentially boosting revenue through enhanced distribution channels and payment solutions across global platforms like Samsung and Huawei.
- Jump into the full analysis health report here for a deeper understanding of Flexion Mobile.
- Explore Flexion Mobile's analyst forecasts in our growth report.
Medcamp (WSE:MDP)
Simply Wall St Financial Health Rating: ★★★★★☆
Overview: Medcamp S.A. operates in the real estate sector and has a market capitalization of PLN23.27 million.
Operations: Medcamp S.A. has not reported any specific revenue segments.
Market Cap: PLN23.27M
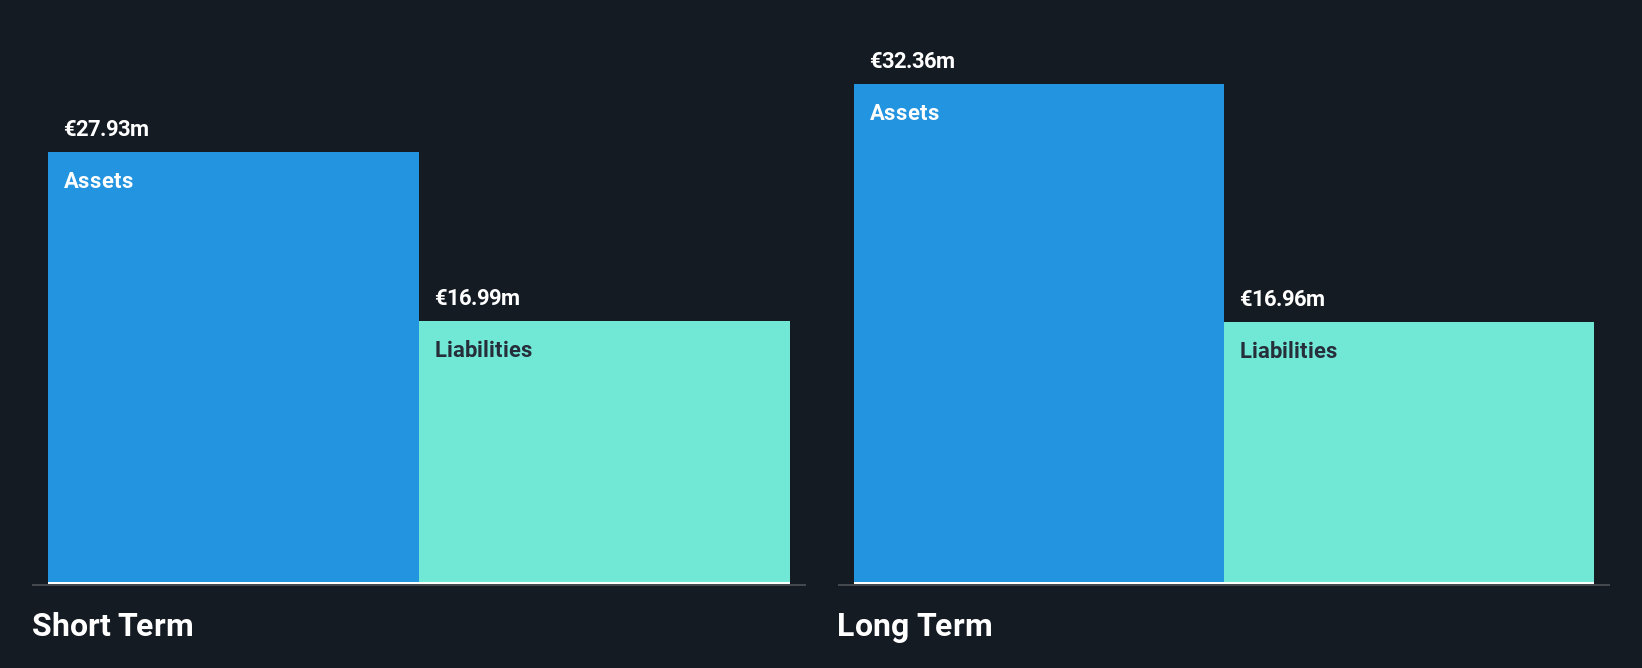
Medcamp S.A., with a market cap of PLN23.27 million, operates in the real estate sector and is currently pre-revenue, making less than US$1 million. The company reported a net loss for Q3 2025 and the first nine months of 2025, highlighting financial challenges. Despite being unprofitable with a negative return on equity, Medcamp has no long-term liabilities and more cash than total debt, providing some financial stability. The board is experienced with an average tenure of six years. However, its share price remains highly volatile compared to other Polish stocks over recent months.
- Take a closer look at Medcamp's potential here in our financial health report.
- Examine Medcamp's past performance report to understand how it has performed in prior years.

Turning Ideas Into Actions
- Click through to start exploring the rest of the 282 European Penny Stocks now.
- Ready For A Different Approach? Trump has pledged to "unleash" American oil and gas and these 22 US stocks have developments that are poised to benefit.
This article by Simply Wall St is general in nature. We provide commentary based on historical data and analyst forecasts only using an unbiased methodology and our articles are not intended to be financial advice. It does not constitute a recommendation to buy or sell any stock, and does not take account of your objectives, or your financial situation. We aim to bring you long-term focused analysis driven by fundamental data. Note that our analysis may not factor in the latest price-sensitive company announcements or qualitative material. Simply Wall St has no position in any stocks mentioned.
Have feedback on this article? Concerned about the content? Get in touch with us directly. Alternatively, email editorial-team@simplywallst.com