
 Nasdaq
 華爾街日報
華爾街日報Is It Too Late To Consider AST SpaceMobile (ASTS) After 281% One Year Surge?
- Investors may be wondering whether AST SpaceMobile's current share price reflects its true worth, or whether expectations have already gone too far ahead of the story.
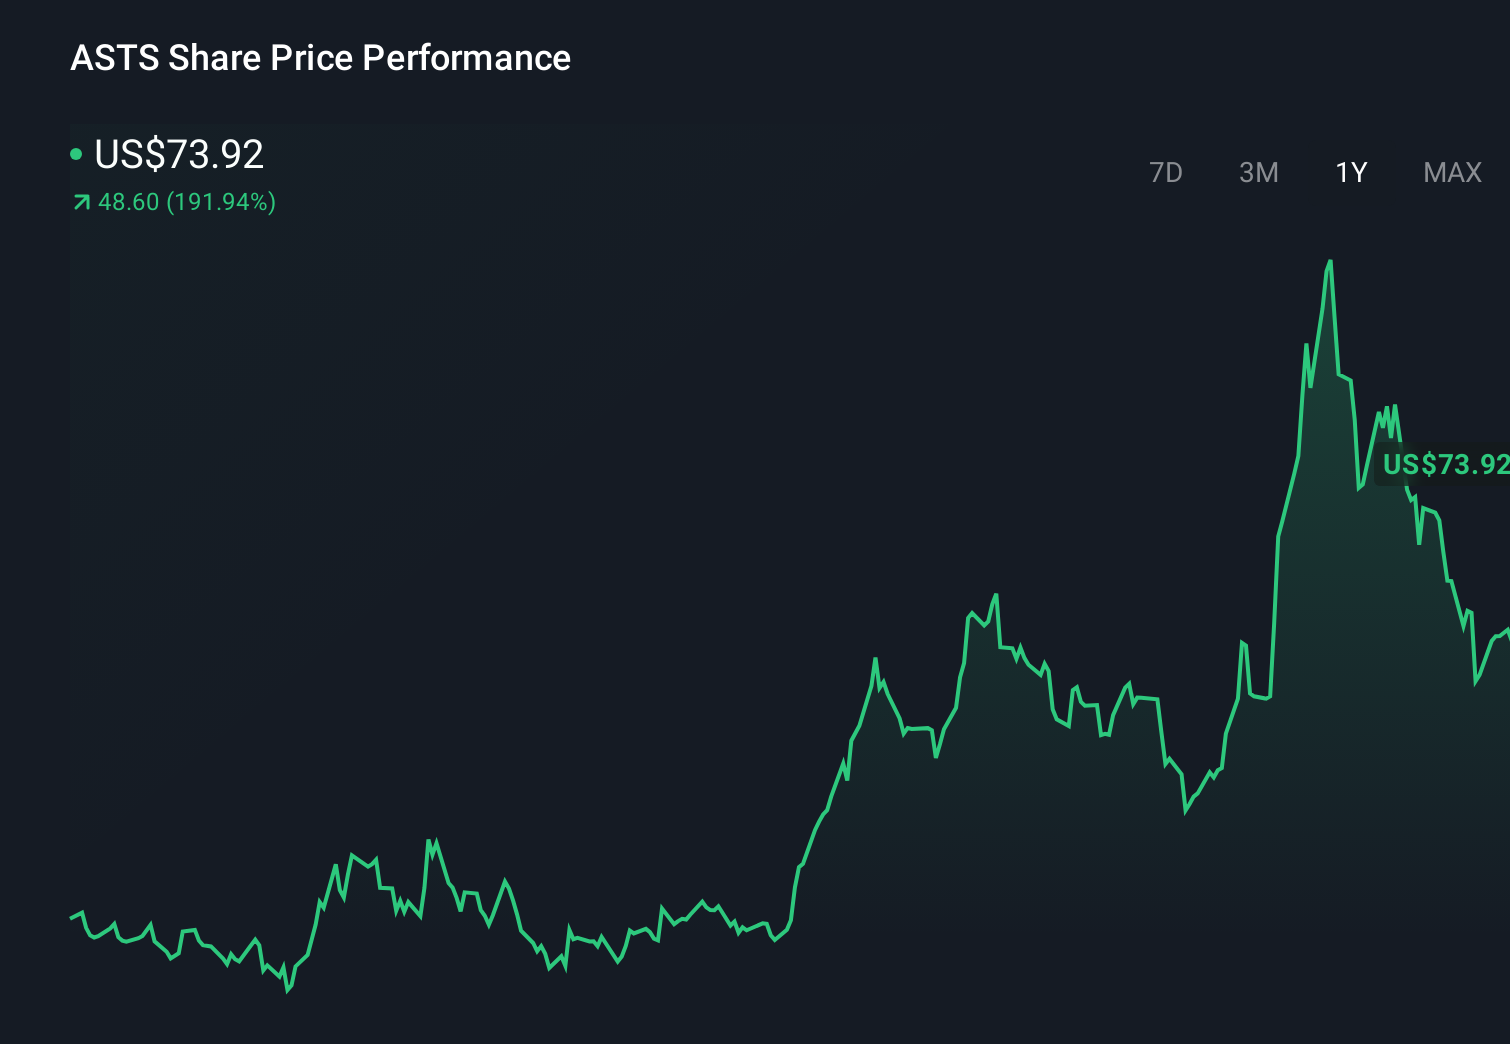
- The stock recently closed at US$85.73, with returns of 18.0% over 7 days, 15.9% over 30 days, 2.7% year to date and 280.9% over 1 year, alongside a very large multi year gain.
- Recent attention on AST SpaceMobile has revolved around its efforts to build a space based cellular broadband network that aims to connect standard mobile phones directly to satellites. Media coverage has focused on its progress toward deploying this system globally and on how its partnerships and technical milestones might affect future adoption and funding.
- Even with this level of interest, AST SpaceMobile currently scores just 1 out of 6 on our valuation checks. Next, we will compare different ways to look at its valuation and then outline a more complete framework that can help you judge the price for yourself.
AST SpaceMobile scores just 1/6 on our valuation checks. See what other red flags we found in the full valuation breakdown.
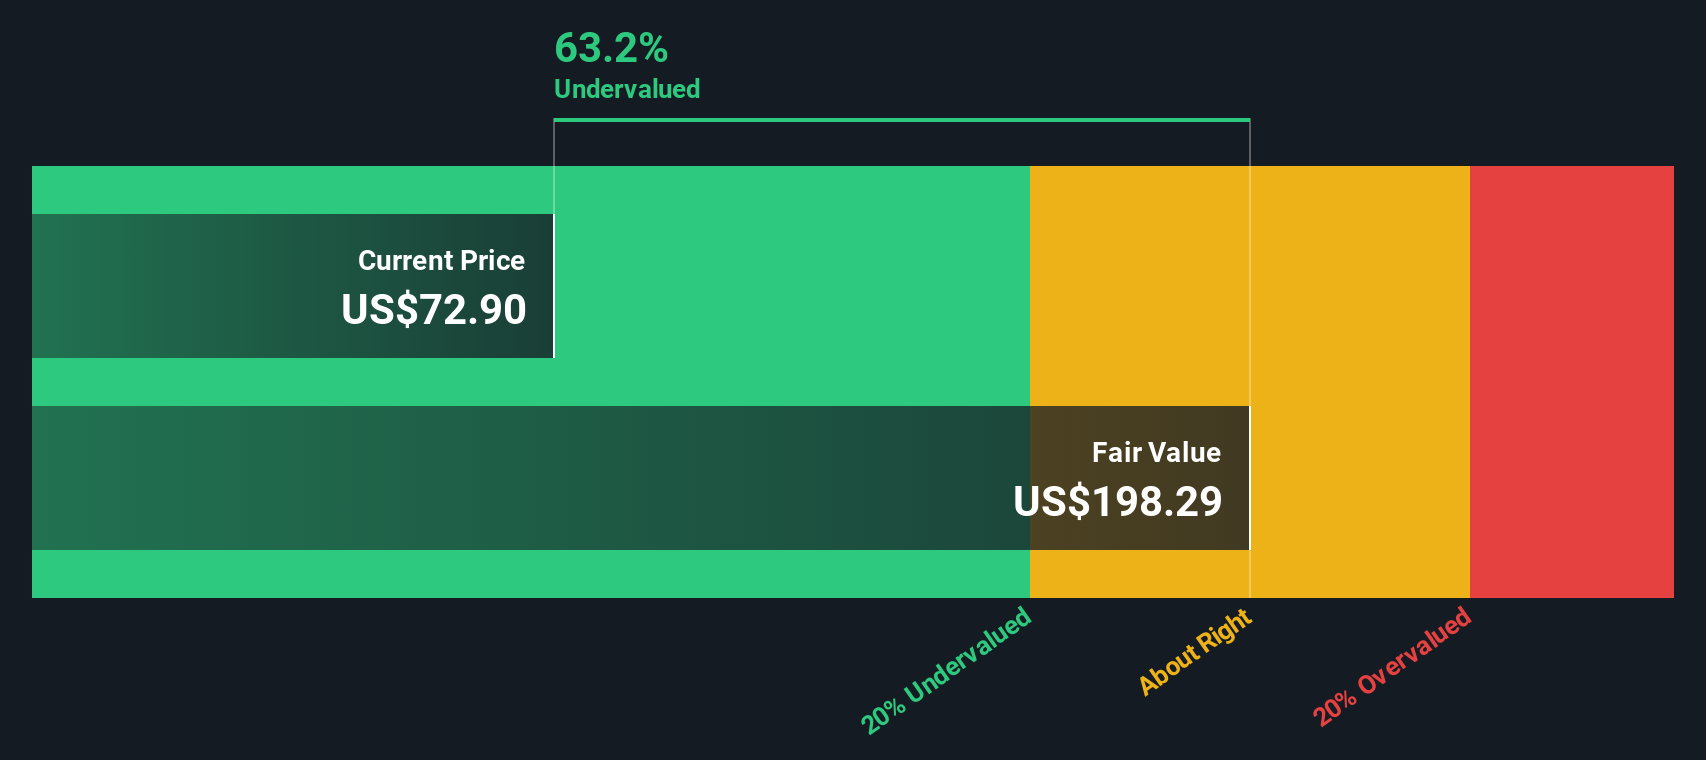
Approach 1: AST SpaceMobile Discounted Cash Flow (DCF) Analysis
A DCF model takes estimates of the cash a business could generate in the future, then discounts those cash flows back to today to arrive at an implied value per share.
For AST SpaceMobile, the model uses a 2 Stage Free Cash Flow to Equity approach based on cash flow projections in $. The latest twelve month free cash flow is a loss of $1,078.1m. Analyst and extrapolated forecasts in the model point to free cash flow of $1,122.2m in 2030, with a path that includes negative and positive years between 2026 and 2035 as set out in the ten year projection table.
When all of those projected cash flows are discounted back to today, the model arrives at an estimated intrinsic value of $102.38 per share, compared with the recent share price of $85.73. That gap implies the shares trade at a 16.3% discount to this particular DCF estimate.
Result: UNDERVALUED
Our Discounted Cash Flow (DCF) analysis suggests AST SpaceMobile is undervalued by 16.3%. Track this in your watchlist or portfolio, or discover 885 more undervalued stocks based on cash flows.
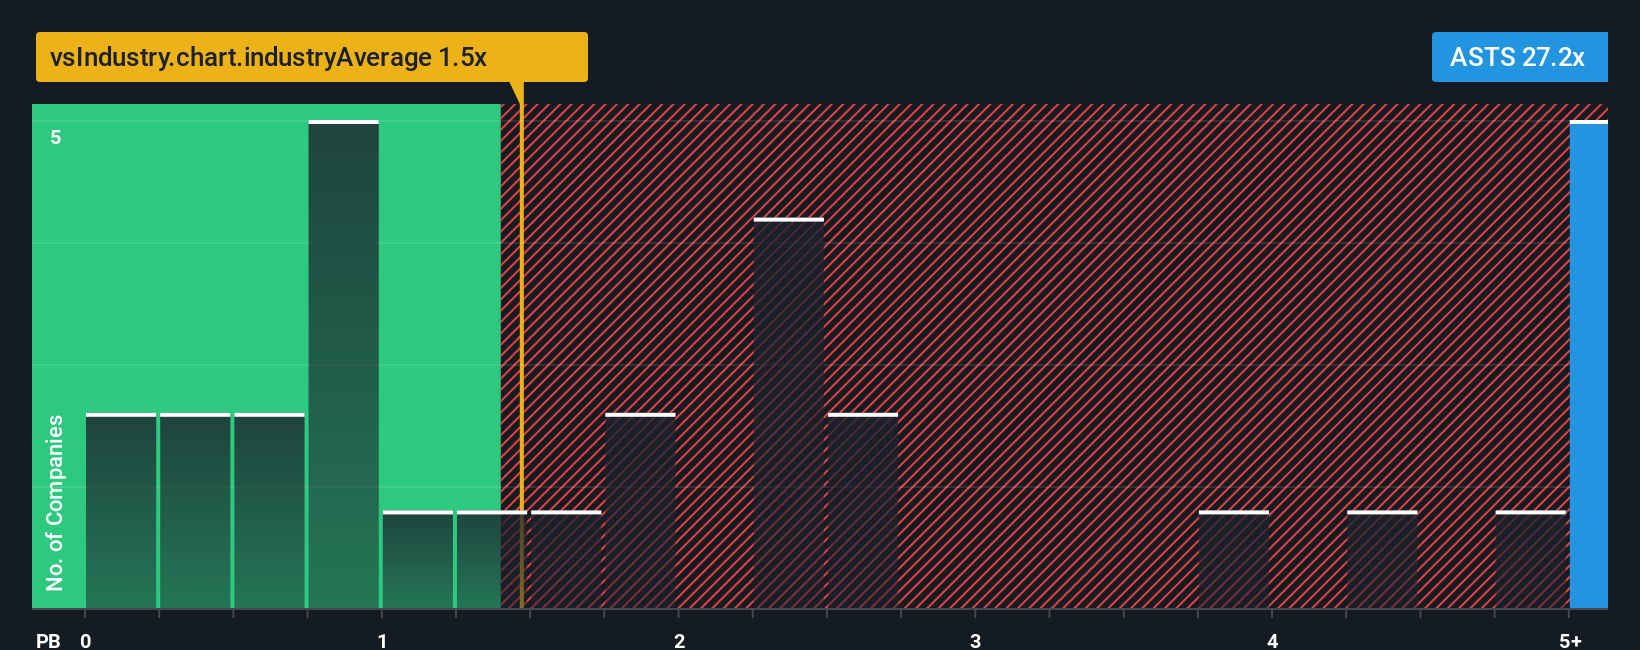
Approach 2: AST SpaceMobile Price vs Book
For companies that are still building toward consistent profitability, the price to book, or P/B, ratio can be a useful way to think about value because it compares the market price to the accounting value of assets rather than current earnings.
In general, investors tend to accept a higher P/B ratio when they expect stronger growth and are comfortable with the risk profile, while slower expected growth or higher risk usually lines up with a lower, more conservative multiple.
AST SpaceMobile currently trades on a P/B ratio of 19.41x. That compares with an average P/B of 1.13x for the wider Telecom industry and 6.14x for its peer group, which highlights how different the market’s expectations appear to be for this company versus more established operators.
Simply Wall St’s Fair Ratio is a proprietary estimate of what a reasonable P/B might look like once you factor in elements such as earnings growth, profit margins, industry, market cap and specific risks, rather than just lining it up against broad industry or peer averages.
Because the Fair Ratio figure for AST SpaceMobile is not available here, you cannot yet make a clean call on whether 19.41x suggests the shares are overvalued, undervalued or about right using this framework alone.
Result: ABOUT RIGHT
P/B ratios tell one story, but what if the real opportunity lies elsewhere? Discover 1449 companies where insiders are betting big on explosive growth.
Upgrade Your Decision Making: Choose your AST SpaceMobile Narrative
Earlier we mentioned that there is an even better way to think about valuation, so let us introduce you to Narratives, which let you attach a clear story to the numbers you are using for fair value, future revenue, earnings and margins.
A Narrative is simply your view of how a company’s story might play out, translated into a forecast and then into a fair value that you can compare with today’s price.
On Simply Wall St, Narratives are available on the Community page and are used by millions of investors as an accessible way to set assumptions, see the implied fair value and then decide whether the gap between Fair Value and Price suggests an opportunity or a warning for their own situation.
These Narratives update automatically when new information such as news or earnings is added to the platform, so your story and valuation stay aligned without you rebuilding a model each time.
For example, one AST SpaceMobile Narrative on the Community page might assume very strong future adoption and place fair value well above US$85.73. Another might use more cautious forecasts and put fair value well below the current price, which shows how two investors can reasonably land in very different places using the same tool.
Do you think there's more to the story for AST SpaceMobile? Head over to our Community to see what others are saying!
This article by Simply Wall St is general in nature. We provide commentary based on historical data and analyst forecasts only using an unbiased methodology and our articles are not intended to be financial advice. It does not constitute a recommendation to buy or sell any stock, and does not take account of your objectives, or your financial situation. We aim to bring you long-term focused analysis driven by fundamental data. Note that our analysis may not factor in the latest price-sensitive company announcements or qualitative material. Simply Wall St has no position in any stocks mentioned.
Have feedback on this article? Concerned about the content? Get in touch with us directly. Alternatively, email editorial-team@simplywallst.com