
 Nasdaq
 華爾街日報
華爾街日報Is It Time To Reconsider Bank Of America (BAC) After Its Strong Multi Year Rally
- If you are wondering whether Bank of America is fairly priced or offering value right now, you are not alone. This article is built to help you frame that question clearly.
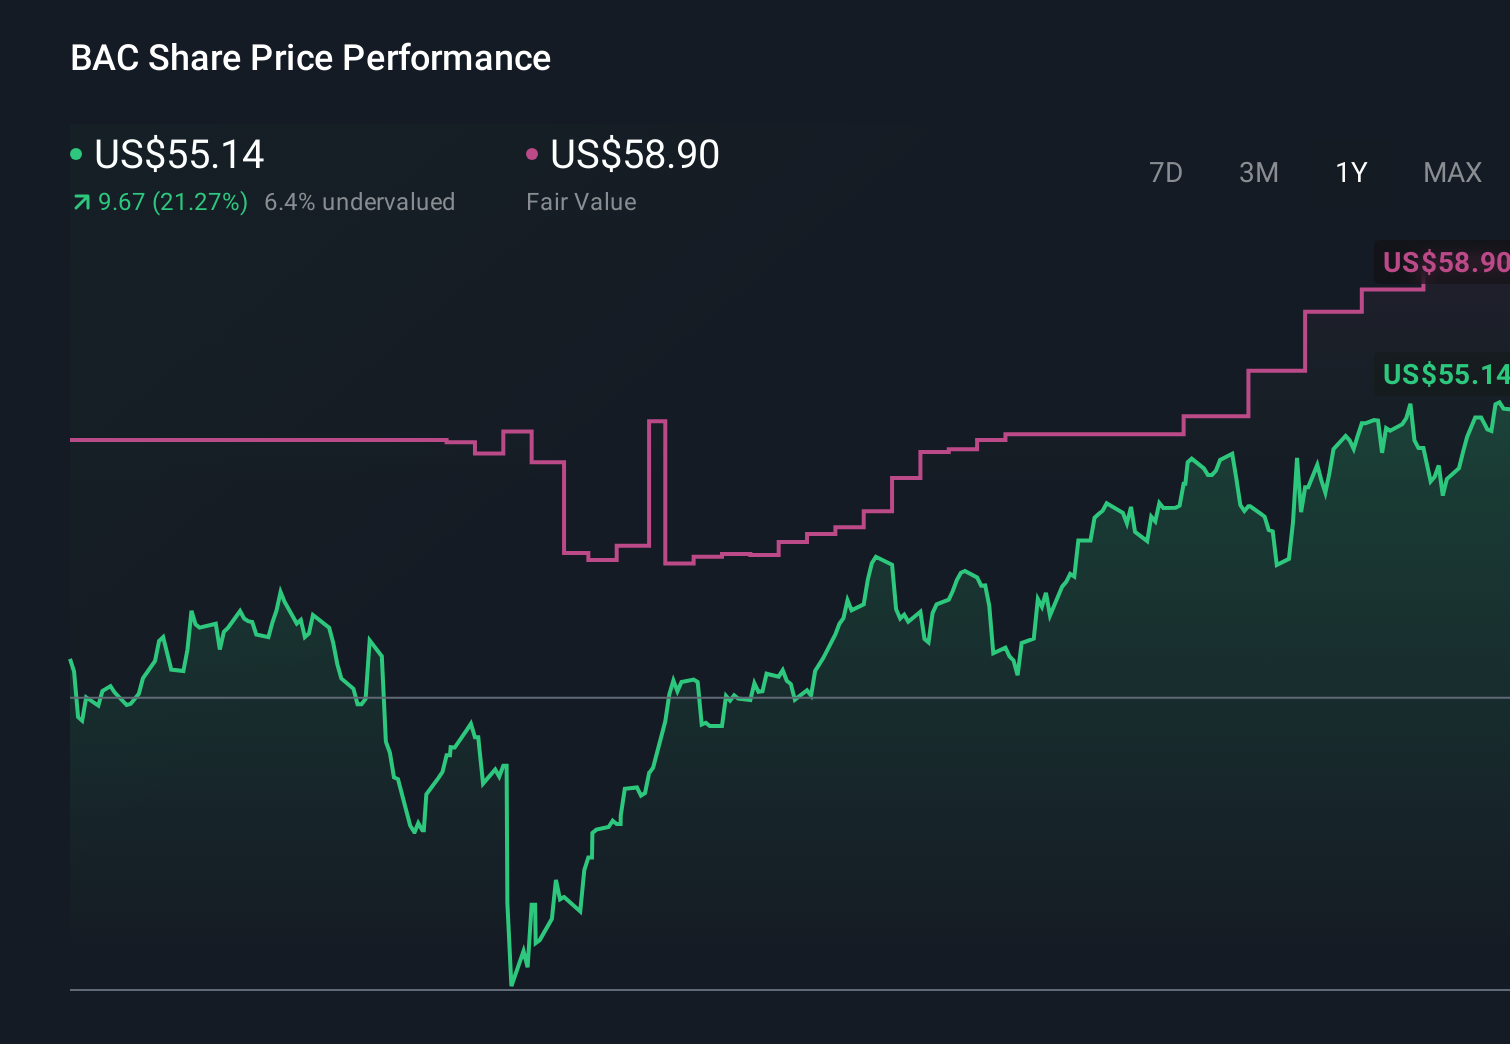
- Bank of America shares recently closed at US$55.64, with returns of 1.2% over 7 days, 3.2% over 30 days, a 0.6% decline year to date, 23.2% over 1 year, 75.1% over 3 years, and 87.6% over 5 years.
- Recent coverage around large U.S. banks has focused on how investors are reassessing big financial institutions, with attention on balance sheet resilience and the interest rate backdrop. That context helps explain why Bank of America’s recent share price moves have drawn fresh interest from long term holders and new investors alike.
- Simply Wall St currently scores Bank of America at 3 out of 6 on its valuation checks, and next we will look at what different methods say about that figure and introduce an even richer way to think about valuation later in the article.
Find out why Bank of America's 23.2% return over the last year is lagging behind its peers.
Approach 1: Bank of America Excess Returns Analysis
The Excess Returns model looks at how much profit a company is expected to generate above the return that shareholders require, then converts those surplus profits into an estimated intrinsic value per share.
For Bank of America, the model starts with a Book Value of $37.95 per share and a Stable EPS of $4.95 per share, based on weighted future Return on Equity estimates from 11 analysts. The Average Return on Equity is 11.61%, while the Cost of Equity is $3.78 per share. That leaves an Excess Return of $1.17 per share, which is the core input for this approach.
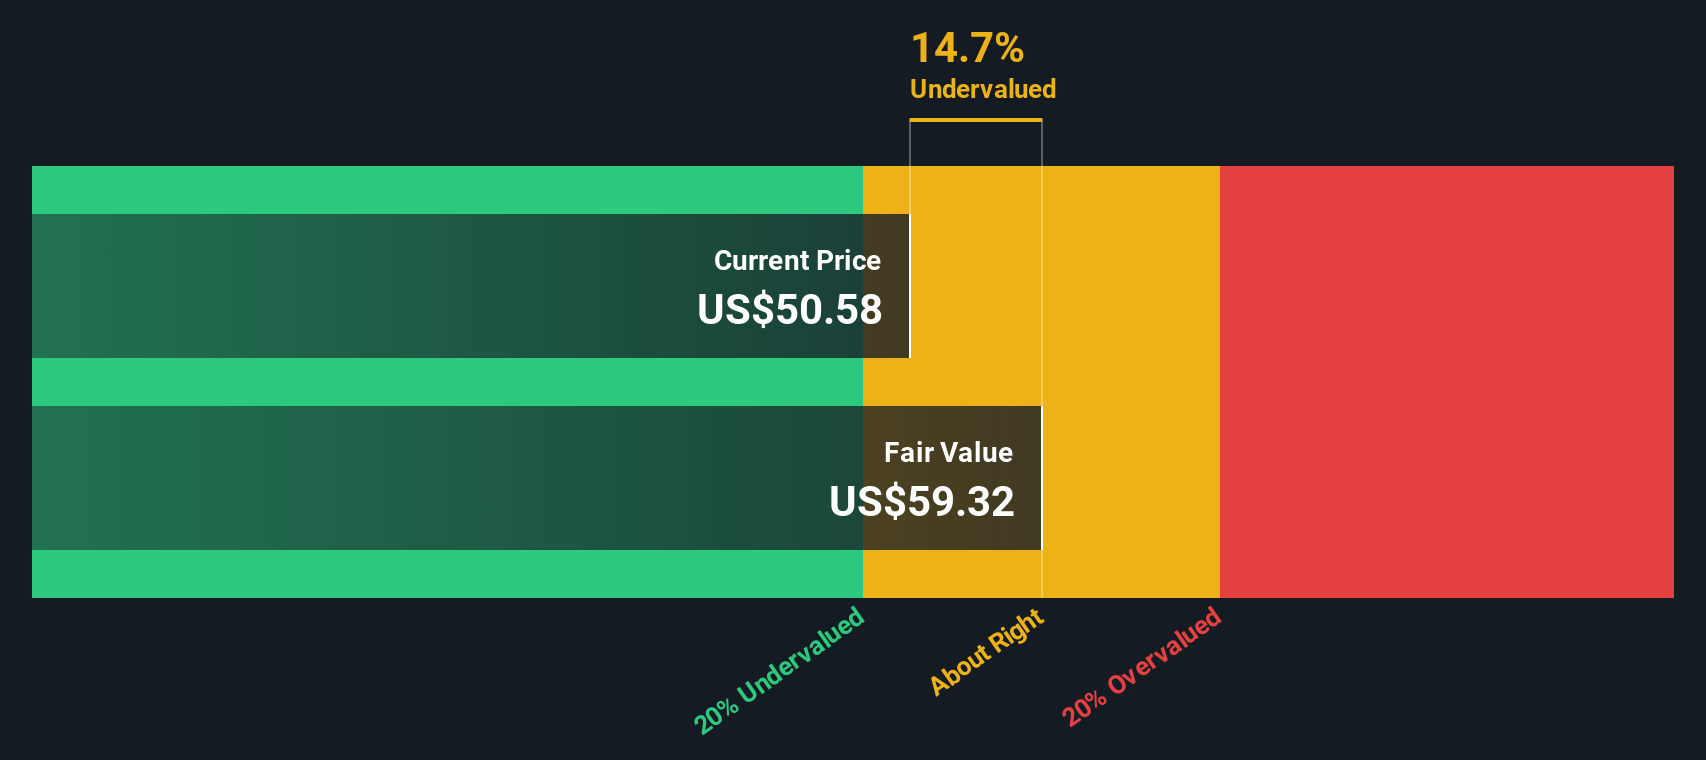
The Stable Book Value is $42.59 per share, sourced from weighted future Book Value estimates from 14 analysts. Using these figures within the Excess Returns framework produces an estimated intrinsic value of US$63.47 per share. Compared with the recent share price of US$55.64, the model implies the stock is 12.3% undervalued.
Result: UNDERVALUED
Our Excess Returns analysis suggests Bank of America is undervalued by 12.3%. Track this in your watchlist or portfolio, or discover 885 more undervalued stocks based on cash flows.
Approach 2: Bank of America Price vs Earnings
The P/E ratio is a useful way to think about valuation for a profitable bank, because it anchors the share price directly to the earnings that common shareholders receive on a per share basis. In general, investors tend to accept a higher or lower P/E depending on what they expect for future earnings growth and how much risk they see in the business and sector.
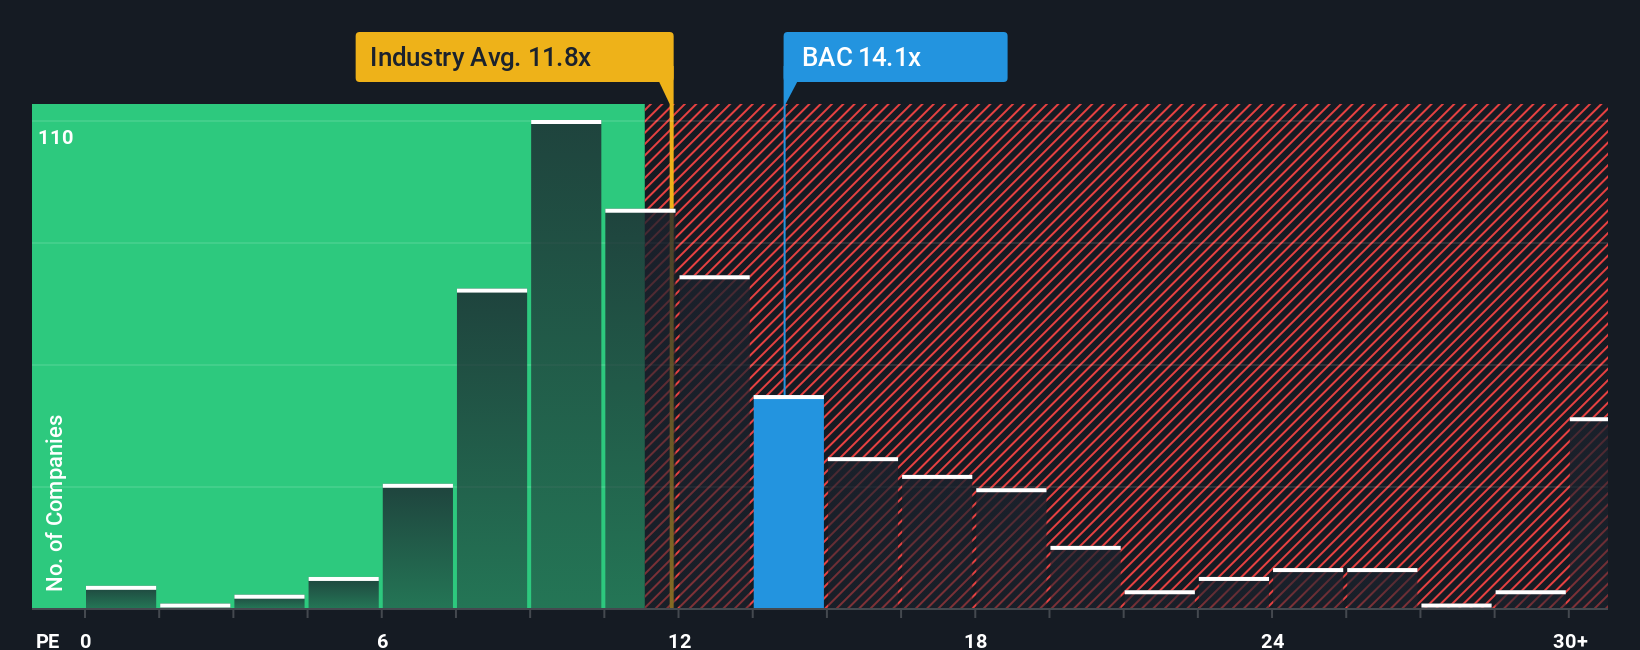
Bank of America currently trades on a P/E of 14.38x. That sits above the Banks industry average P/E of 11.87x and a little below the peer group average of 14.80x. On the surface, that suggests the market is pricing BAC broadly in line with similar large bank stocks, and modestly above the wider sector.
Simply Wall St also calculates a Fair Ratio of 16.63x, which is the P/E it would expect for Bank of America given factors such as its earnings profile, industry, profit margin, market cap and risk inputs. This Fair Ratio aims to be more tailored than a simple comparison with peers or the industry average because it layers in company specific growth and risk considerations. Set against the current 14.38x P/E, the Fair Ratio points to Bank of America trading below that model based estimate.
Result: UNDERVALUED
P/E ratios tell one story, but what if the real opportunity lies elsewhere? Discover 1449 companies where insiders are betting big on explosive growth.
Upgrade Your Decision Making: Choose your Bank of America Narrative
Earlier we mentioned that there is an even better way to think about valuation, and on Simply Wall St that comes through Narratives. On the Community page, you and other investors connect a clear story about Bank of America with specific assumptions for future revenue, earnings and margins. These are then turned into a Fair Value, which you can compare to the current share price. The platform updates those Narratives automatically as fresh news or earnings arrive. One investor might build a cautious story that lines up more closely with the lower analyst price target of US$46.00, while another might lean into a more optimistic story that aligns with the higher Narrative-based fair value of about US$59.65. Seeing those side by side helps you decide which story and Fair Value best matches your own view before you choose when to act.
For Bank of America however we will make it really easy for you with previews of two leading Bank of America Narratives:
Fair value: US$59.65
Implied pricing gap vs recent close: about 6.7% below this narrative fair value
Revenue growth assumption: 7.86% per year
- Analysts are building in annual revenue growth of 7.4% to 2028, with earnings expected to reach US$32.9b and earnings per share of US$4.74.
- Margins are assumed to stay broadly similar to today. Ongoing share buybacks are assumed to reduce the share count by 3.47% per year and support earnings per share.
- This view ties the current analyst consensus price target of US$53.52 to a 2028 P/E of 13.8x and a discount rate of about 8.3%, with the current price sitting close to that target.
Fair value: US$43.34
Implied pricing gap vs recent close: about 28.4% above this narrative fair value
Revenue growth assumption: 10.59% per year
- This narrative assumes Bank of America grows net income by 5.5% a year to 2030, with total revenue reaching US$112b and net income of US$39.8b, then values the shares on an 11x P/E.
- It factors in higher for longer interest rates, moderate economic growth and ongoing efficiencies. It also highlights risks from regulation, rate cuts, recessions and further Berkshire Hathaway selling.
- On these assumptions, the present value comes out at US$43.34 per share, which sits below the recent share price and implies less room for error at current levels.
Both Narratives use publicly available assumptions but arrive at very different fair values. Your next step is to decide which story feels closer to your view of Bank of America, its balance sheet strength and the outlook for rates, regulation and credit quality.
Curious how numbers become stories that shape markets? Explore Community Narratives
Do you think there's more to the story for Bank of America? Head over to our Community to see what others are saying!
This article by Simply Wall St is general in nature. We provide commentary based on historical data and analyst forecasts only using an unbiased methodology and our articles are not intended to be financial advice. It does not constitute a recommendation to buy or sell any stock, and does not take account of your objectives, or your financial situation. We aim to bring you long-term focused analysis driven by fundamental data. Note that our analysis may not factor in the latest price-sensitive company announcements or qualitative material. Simply Wall St has no position in any stocks mentioned.
Have feedback on this article? Concerned about the content? Get in touch with us directly. Alternatively, email editorial-team@simplywallst.com