
 Nasdaq
 華爾街日報
華爾街日報Is It Too Late To Consider Welltower (WELL) After Its Strong Multi Year Share Price Run?
- If you are wondering whether Welltower is still reasonably priced after its strong run, this article walks through what the current share price might be implying about future expectations.
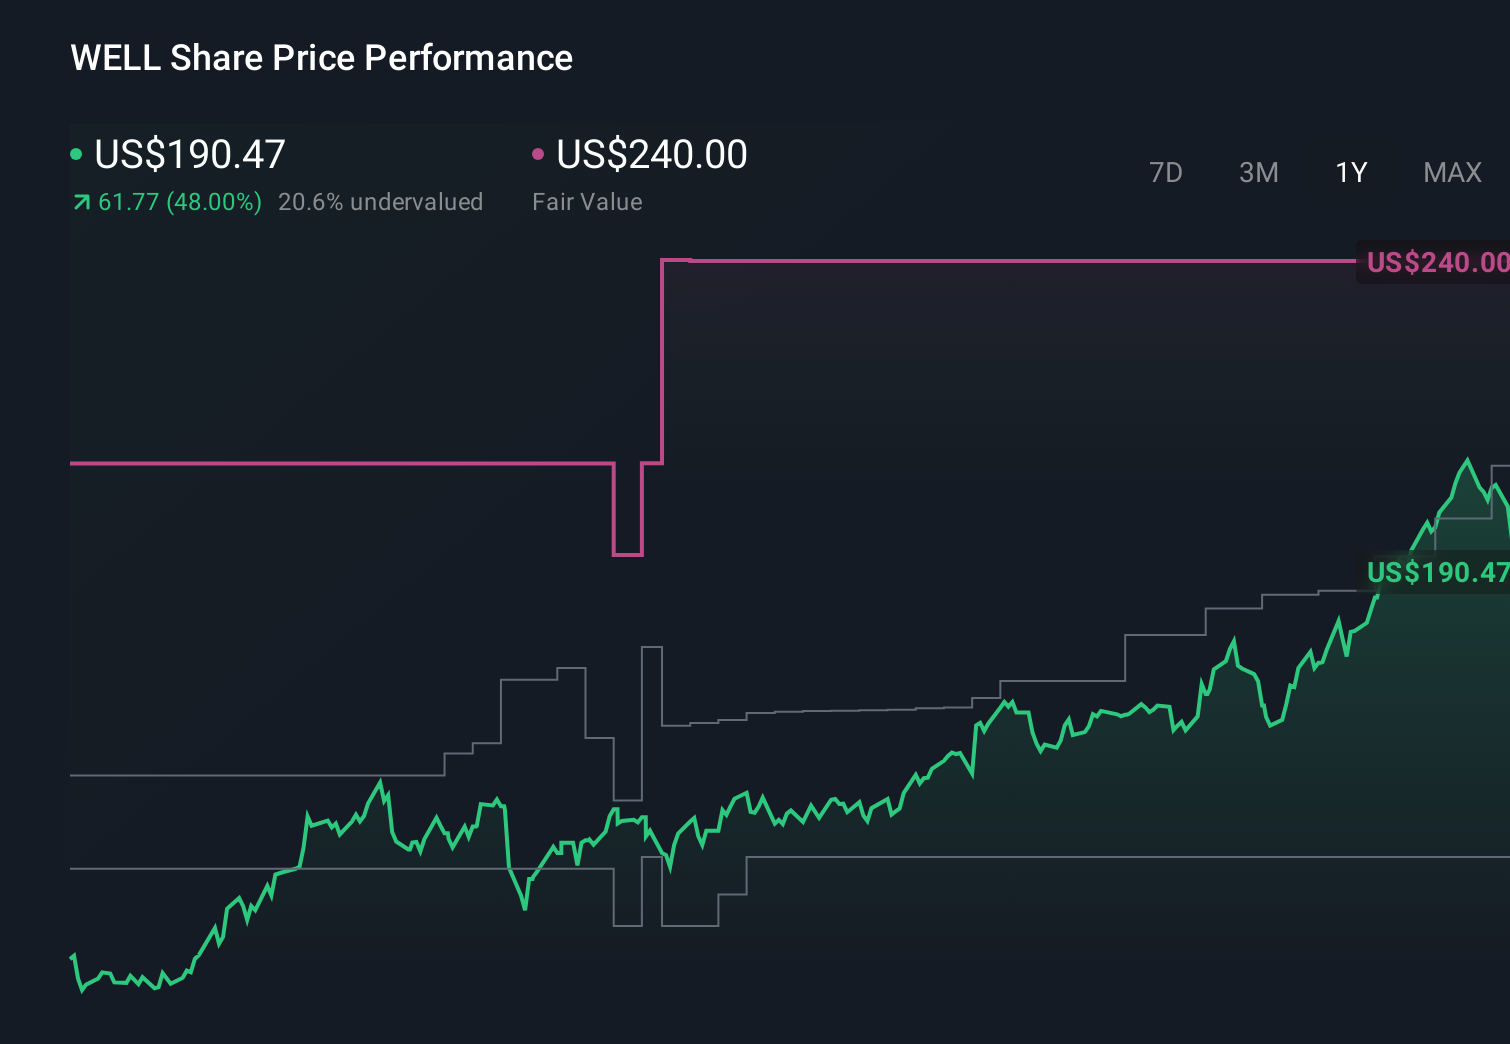
- The stock closed at US$185.65, with a flat 7 day return, a 7.6% decline over 30 days, a 0.7% decline year to date, a 49.4% return over 1 year, a 177.5% return over 3 years, and a 232.5% return over 5 years. This gives you a wide range of time frames to think about risk and reward.
- Recent coverage around Welltower has focused on its role in the US real estate sector and how investors are treating healthcare focused property owners in their portfolios. This context helps explain why interest in the stock has stayed high even as shorter term returns have been more mixed.
- Simply Wall St currently gives Welltower a valuation score of 0/6. We will look at what different valuation approaches say about that score, then finish with a more rounded way to think about what the market might be pricing in.
Welltower scores just 0/6 on our valuation checks. See what other red flags we found in the full valuation breakdown.
Approach 1: Welltower Discounted Cash Flow (DCF) Analysis
The DCF model here takes Welltower’s adjusted funds from operations, projects them forward, then discounts those future cash flows back to today to estimate what the business might be worth in $ right now.
For the latest twelve months, Simply Wall St estimates free cash flow of about $2.3b. The model then uses analyst inputs and its own extrapolations to project FCF out to 2035, including an estimate of $5.4b in 2030. Those 10 year forecasts blend analyst estimates through 2030 with further calculated growth from 2031 to 2035.
Discounting those projected cash flows back to today gives an intrinsic value estimate of about $184.68 per share, compared with the recent share price of $185.65. That implies the stock is roughly 0.5% above the DCF estimate, which is effectively a neutral reading rather than a clear signal in either direction.
Result: ABOUT RIGHT
Welltower is fairly valued according to our Discounted Cash Flow (DCF), but this can change at a moment's notice. Track the value in your watchlist or portfolio and be alerted on when to act.

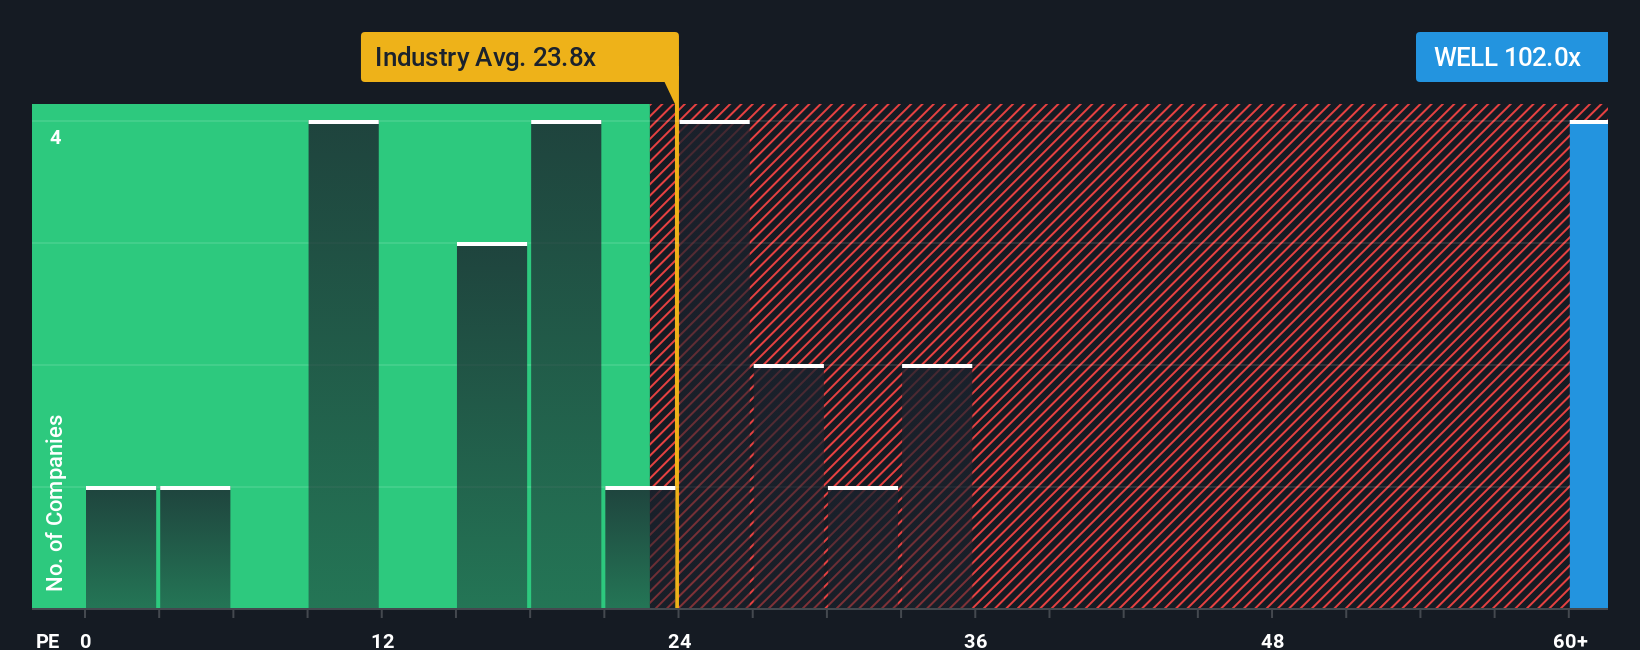
Approach 2: Welltower Price vs Earnings
For a profitable company like Welltower, the P/E ratio is a useful way to connect what you pay for each share with the earnings that support that price. It helps you see how much investors are currently paying for each dollar of earnings.
What counts as a "normal" or "fair" P/E depends on how the market views a company’s growth potential and risk. Higher expected growth or lower perceived risk can justify a higher multiple, while slower expected growth or higher risk usually points to a lower one.
Welltower currently trades on a P/E of 132.67x. That is well above the Health Care REITs industry average P/E of 25.82x and also above the peer average of 58.73x. Simply Wall St’s Fair Ratio for Welltower is 39.46x, which is its proprietary view of what a reasonable P/E might be, given factors like earnings growth, industry, profit margin, market cap and risk profile.
The Fair Ratio can be more informative than a simple peer or industry comparison because it adjusts for company specific fundamentals rather than assuming all companies deserve the same multiple. Comparing 132.67x to the 39.46x Fair Ratio suggests the shares are pricing in materially higher expectations than this framework implies.
Result: OVERVALUED
P/E ratios tell one story, but what if the real opportunity lies elsewhere? Discover 1449 companies where insiders are betting big on explosive growth.
Upgrade Your Decision Making: Choose your Welltower Narrative
Earlier we mentioned that there is an even better way to understand valuation. Narratives on Simply Wall St let you attach your own story about Welltower’s future revenue, earnings and margins to a forecast and a fair value, then compare that fair value with the current price. You can see it update automatically when news or earnings arrive, and even see how different investors on the Community page might land at very different views. For example, one Narrative may anchor closer to a fair value of about US$146 per share and another closer to US$240 per share, based on the same set of facts interpreted in different ways.
Do you think there's more to the story for Welltower? Head over to our Community to see what others are saying!
This article by Simply Wall St is general in nature. We provide commentary based on historical data and analyst forecasts only using an unbiased methodology and our articles are not intended to be financial advice. It does not constitute a recommendation to buy or sell any stock, and does not take account of your objectives, or your financial situation. We aim to bring you long-term focused analysis driven by fundamental data. Note that our analysis may not factor in the latest price-sensitive company announcements or qualitative material. Simply Wall St has no position in any stocks mentioned.
Have feedback on this article? Concerned about the content? Get in touch with us directly. Alternatively, email editorial-team@simplywallst.com