
 Nasdaq
 華爾街日報
華爾街日報Is L3Harris Technologies (LHX) Pricing Reflect Its DCF Upside After Strong One-Year Rally
- If you are wondering whether L3Harris Technologies' current share price matches its fundamentals, this article walks through what the numbers say about value, not just recent headlines.
- The stock last closed at US$309.76, with returns of 5.5% over 7 days, 10.0% over 30 days, 1.7% year to date, 52.4% over 1 year, 65.1% over 3 years, and 83.7% over 5 years, which may influence how investors think about both potential and risk today.
- Recent attention on the defense and aerospace sector, including supply chain developments and contract wins across the industry, has put companies like L3Harris under a closer spotlight. That backdrop helps explain why investors may be reassessing what they are willing to pay for the shares right now.
- L3Harris currently has a value score of 3 out of 6. This suggests the stock screens as undervalued on half of the checks we run. Next, we will look at how methods like discounted cash flow and multiples compare, before finishing with a more holistic way to think about valuation that pulls everything together.
Find out why L3Harris Technologies's 52.4% return over the last year is lagging behind its peers.
Approach 1: L3Harris Technologies Discounted Cash Flow (DCF) Analysis
A Discounted Cash Flow, or DCF, model estimates what a company might be worth by projecting the cash it could generate in the future and discounting those cash flows back to today.
For L3Harris Technologies, the model used is a 2 Stage Free Cash Flow to Equity approach. The latest twelve month free cash flow is about $1.85b. Analyst inputs and extrapolated estimates point to free cash flow of around $3.05b in 2026, rising to about $4.57b by 2035, with a specific projection of $3.67b for 2029. Simply Wall St discounts each of these future cash flows to their value in today’s dollars using its own assumptions.
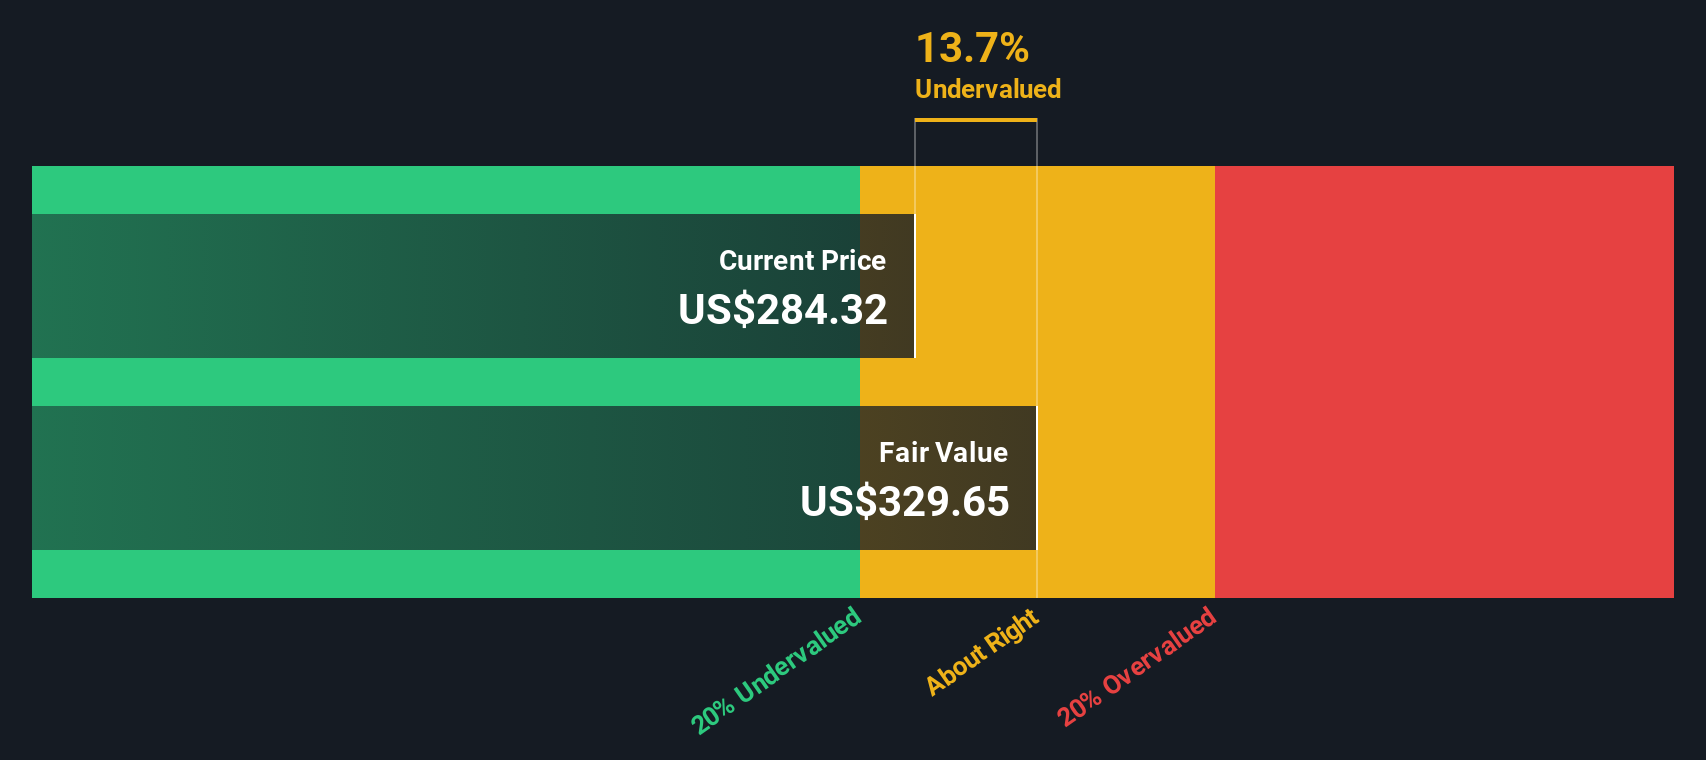
Putting those cash flows together, the DCF model arrives at an estimated intrinsic value of about $380.38 per share. Compared with the recent share price of $309.76, this implies the stock is trading at roughly an 18.6% discount, which suggests the shares screen as undervalued on this method.
Result: UNDERVALUED
Our Discounted Cash Flow (DCF) analysis suggests L3Harris Technologies is undervalued by 18.6%. Track this in your watchlist or portfolio, or discover 885 more undervalued stocks based on cash flows.
Approach 2: L3Harris Technologies Price vs Earnings
For a profitable company like L3Harris Technologies, the P/E ratio is a useful way to gauge what the market is willing to pay for each dollar of earnings. It captures, in a single number, how investors balance current earnings with what they expect those earnings to look like in the future.
In simple terms, higher growth expectations and lower perceived risk usually justify a higher P/E, while slower expected growth or higher risk often line up with a lower P/E. So the question is not whether a P/E is high or low in isolation, but whether it fits the company’s profile.
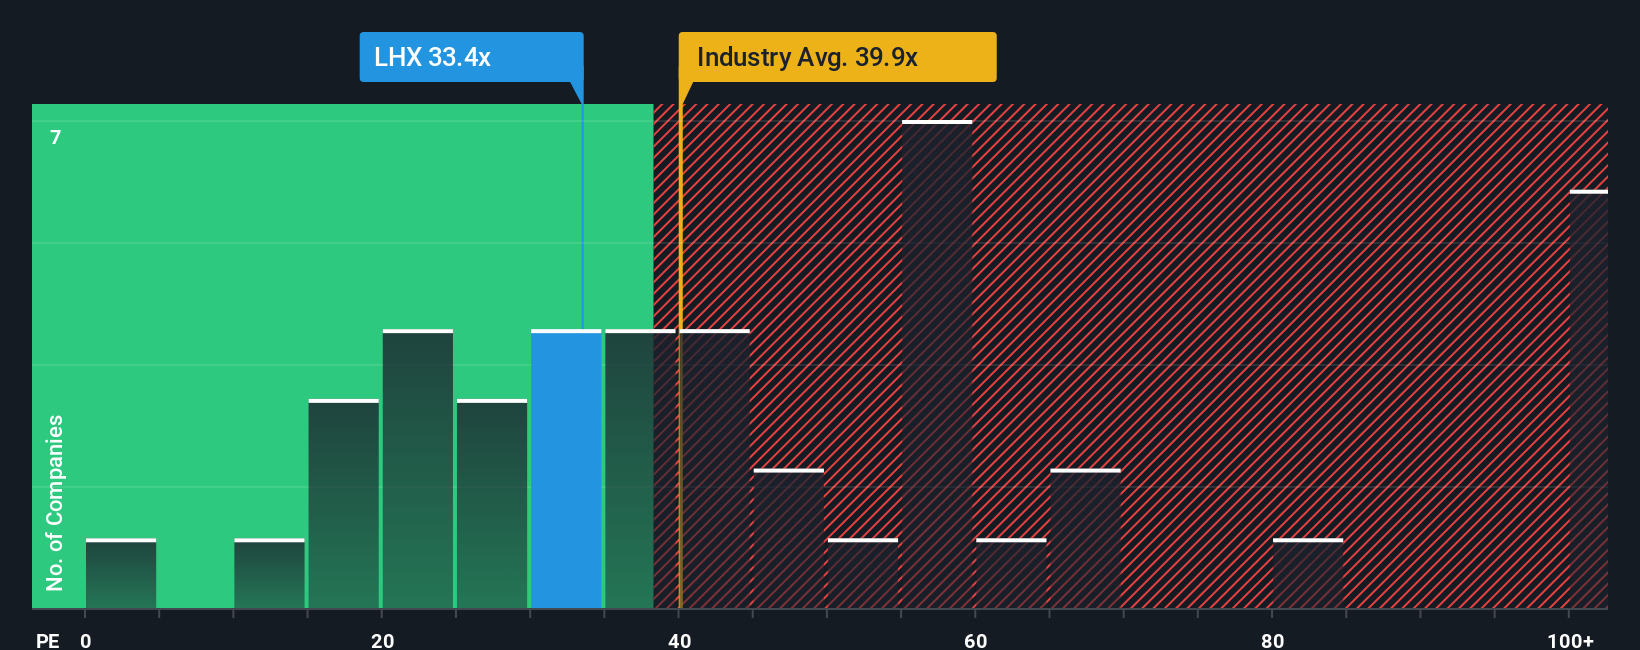
L3Harris currently trades on a P/E of 32.94x, compared with a peer average of 35.74x and an Aerospace & Defense industry average of 40.43x. Simply Wall St’s Fair Ratio for L3Harris is 30.23x, a proprietary estimate of what its P/E might be given factors such as earnings growth, profit margins, size, risks and its industry. Because this Fair Ratio is tailored to the company, it can be more informative than a simple peer or industry comparison. With the actual P/E sitting above the Fair Ratio, the shares screen as somewhat expensive on this metric.
Result: OVERVALUED
P/E ratios tell one story, but what if the real opportunity lies elsewhere? Discover 1449 companies where insiders are betting big on explosive growth.
Upgrade Your Decision Making: Choose your L3Harris Technologies Narrative
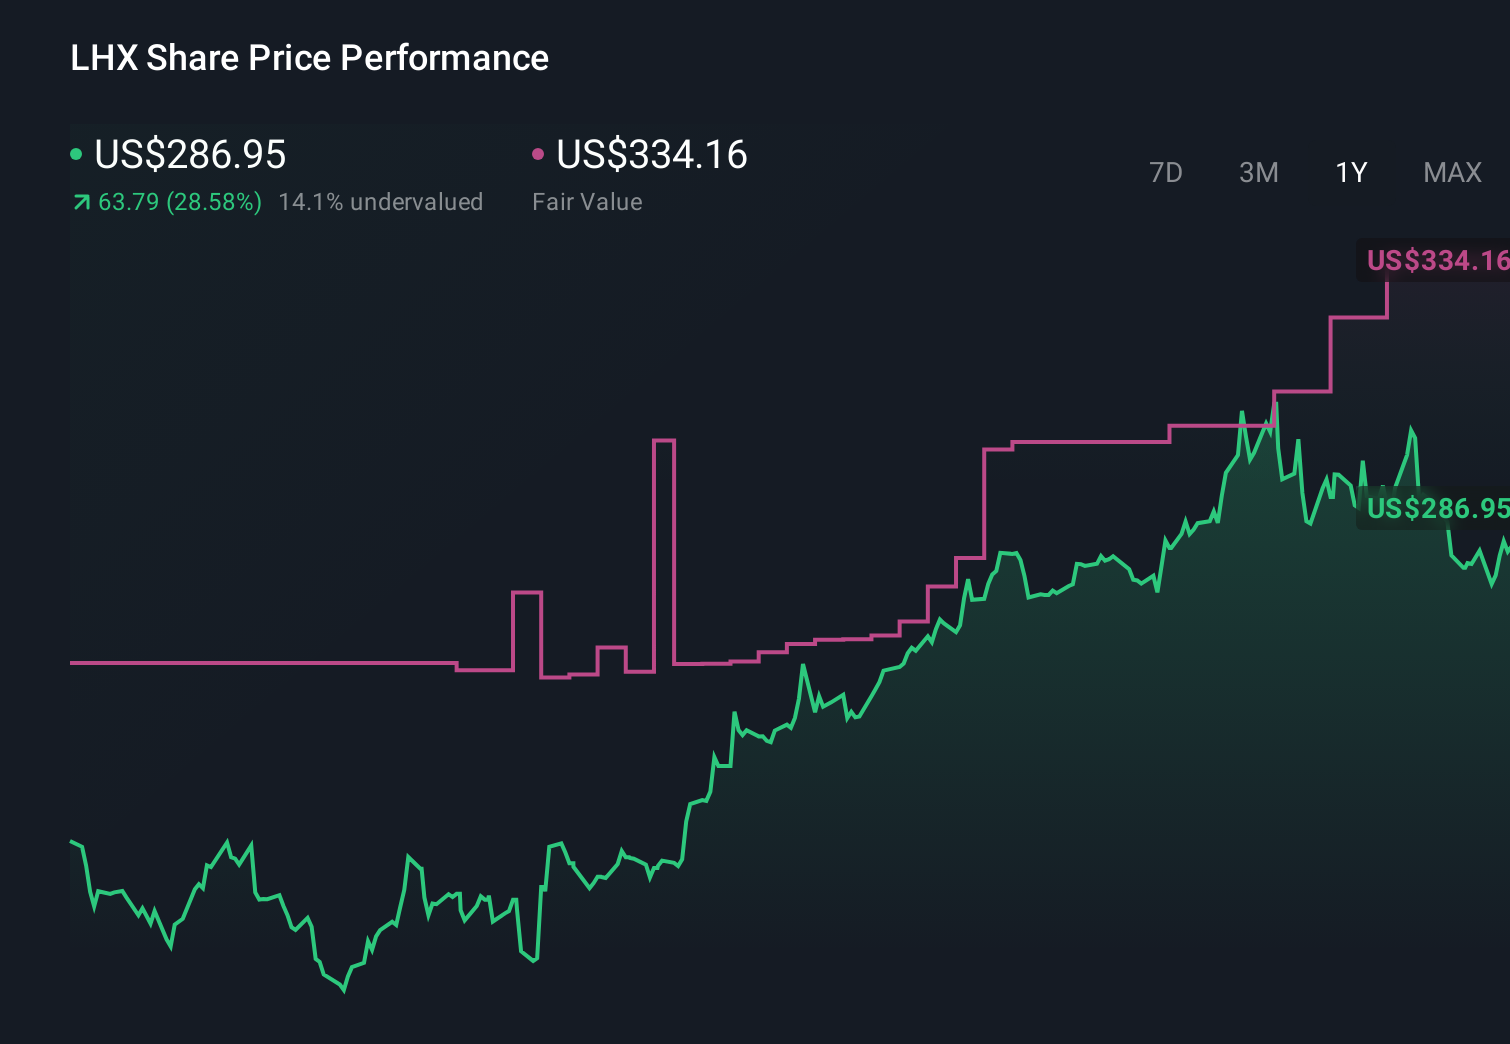
Earlier we mentioned that there is an even better way to think about valuation, so let us introduce Narratives, which let you attach a clear story about L3Harris Technologies to the numbers you care about, linking your view of its future revenue, earnings and margins to a forecast, a fair value, and then to a simple comparison between Fair Value and the current Price. Narratives on Simply Wall St, available on the Community page used by millions of investors, are easy to set up, update automatically when new earnings or news come in, and help you decide whether the gap between your fair value and the live share price looks like an opportunity or a warning. For example, one L3Harris Narrative might lean toward the higher fair value of about US$334.26 based on confidence in future awards and earnings, while a more cautious Narrative could lean closer to the lower analyst target of US$250. Seeing those side by side makes it clear how different assumptions lead to very different views on what the stock is worth.
Do you think there's more to the story for L3Harris Technologies? Head over to our Community to see what others are saying!
This article by Simply Wall St is general in nature. We provide commentary based on historical data and analyst forecasts only using an unbiased methodology and our articles are not intended to be financial advice. It does not constitute a recommendation to buy or sell any stock, and does not take account of your objectives, or your financial situation. We aim to bring you long-term focused analysis driven by fundamental data. Note that our analysis may not factor in the latest price-sensitive company announcements or qualitative material. Simply Wall St has no position in any stocks mentioned.
Have feedback on this article? Concerned about the content? Get in touch with us directly. Alternatively, email editorial-team@simplywallst.com