
 Nasdaq
 華爾街日報
華爾街日報Is It Too Late To Consider Qualcomm (QCOM) After Multi‑Year Share Price Gains?
- If you are wondering whether QUALCOMM's share price still offers good value, the key is understanding what the current market price is actually assuming about its future.
- The stock recently closed at US$180.19, with returns of 5.3% over 7 days, 2.8% over 30 days, 4.2% year to date, 15.8% over 1 year, 62.9% over 3 years and 27.5% over 5 years. This has many investors asking if expectations have already been priced in.
- Recent headlines around QUALCOMM have focused on its role within the broader semiconductor sector and how investors are treating large chip names as key benchmarks for sentiment toward connected devices and wireless technology. This backdrop helps explain why the stock's performance over multiple time frames is being watched closely as a guide to how much risk and potential reward the market currently sees in the business.
- On our checks, QUALCOMM scores a 2 out of 6 valuation score, which suggests there is more to unpack when you compare different valuation approaches. We will also look at a way of thinking about value at the end of the article that can help tie all of these methods together.
QUALCOMM scores just 2/6 on our valuation checks. See what other red flags we found in the full valuation breakdown.
Approach 1: QUALCOMM Discounted Cash Flow (DCF) Analysis
A Discounted Cash Flow, or DCF, model takes projections of a company’s future cash flows and discounts them back to today’s dollars, to estimate what the entire business might be worth right now.
For QUALCOMM, the model uses last twelve months free cash flow of about US$12.6b and a 2 Stage Free Cash Flow to Equity approach. Analyst estimates are used for the next few years, then Simply Wall St extrapolates further out, with projected free cash flow reaching about US$15.2b in 2030. These ten year cash flow projections are all expressed in US$, then discounted back to today using the model’s required return.
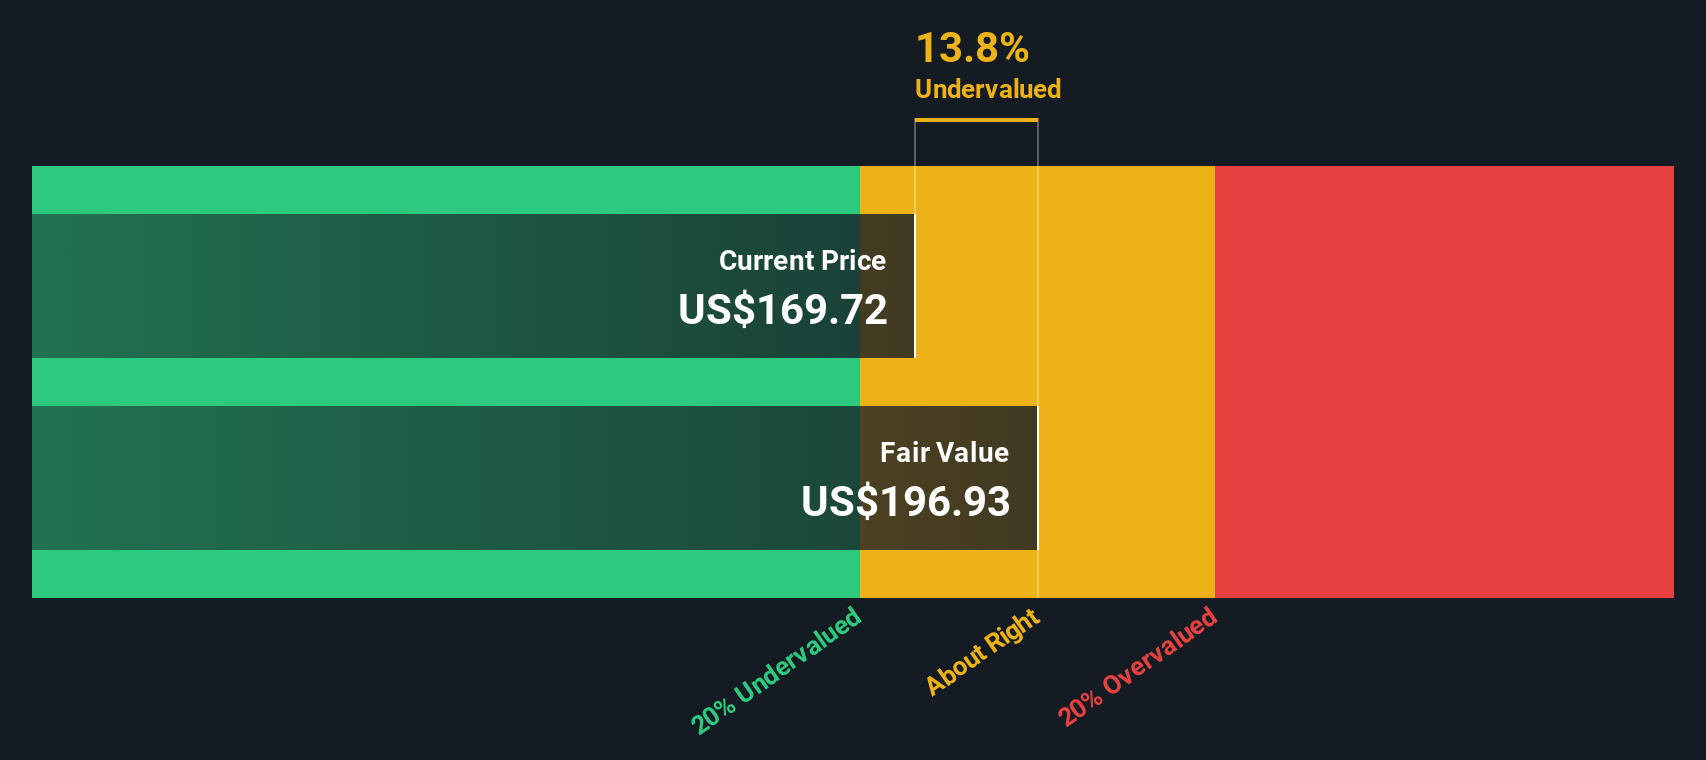
On this basis, the DCF output suggests an estimated intrinsic value of around US$165.13 per share. Compared with the recent share price of US$180.19, the model implies the stock is about 9.1% overvalued. This is a relatively small gap and well within the kind of margin where assumptions make a big difference.
Result: ABOUT RIGHT
QUALCOMM is fairly valued according to our Discounted Cash Flow (DCF), but this can change at a moment's notice. Track the value in your watchlist or portfolio and be alerted on when to act.
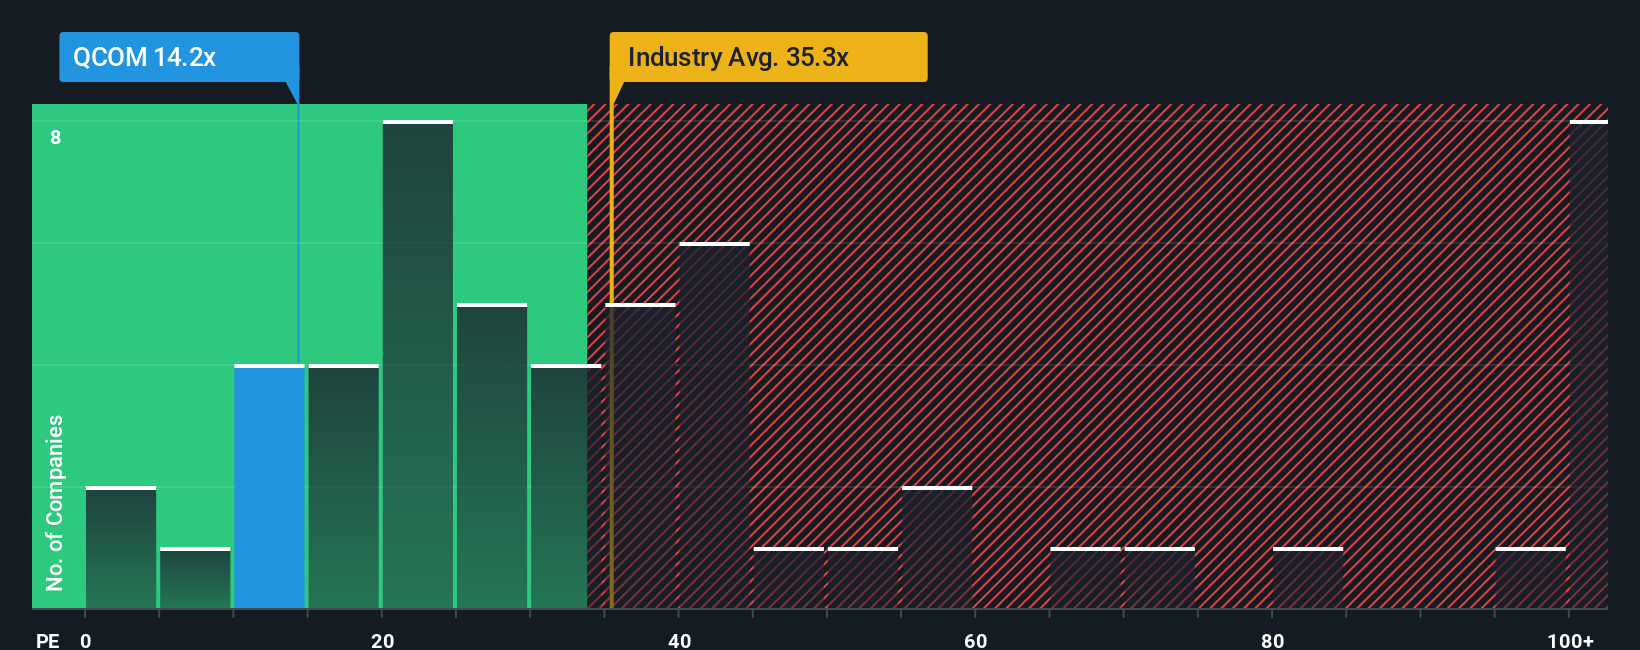
Approach 2: QUALCOMM Price vs Earnings
For a profitable business like QUALCOMM, the P/E ratio is a useful way to gauge what investors are paying for each dollar of earnings. It ties directly to the bottom line, which is what ultimately supports dividends and buybacks over time.
What counts as a “normal” P/E tends to move around with expectations for earnings growth and the risk investors see in those earnings. Higher expected growth or lower perceived risk can justify a higher multiple, while more uncertainty can point to a lower one.
QUALCOMM is currently trading on a P/E of 34.57x. That sits below the peer group average of 88.49x and also below the broader Semiconductor industry average of 41.19x. Simply Wall St’s Fair Ratio for QUALCOMM is 32.75x, which is its proprietary estimate of what a reasonable P/E could be given factors like earnings growth, profit margins, industry, market cap and risk profile.
The Fair Ratio can be more useful than a straight comparison with peers or the industry, because it adjusts for QUALCOMM’s own characteristics rather than assuming all semiconductor companies deserve the same multiple. With the actual P/E of 34.57x only modestly above the Fair Ratio of 32.75x, the stock appears slightly expensive on this measure.
Result: OVERVALUED
P/E ratios tell one story, but what if the real opportunity lies elsewhere? Discover 1449 companies where insiders are betting big on explosive growth.
Upgrade Your Decision Making: Choose your QUALCOMM Narrative
Earlier we mentioned that there is an even better way to understand valuation, so let us introduce you to Narratives, which are simple stories you build around QUALCOMM that link your view of its business, your assumptions about future revenue, earnings and margins, and the fair value those forecasts imply.
On Simply Wall St’s Community page, Narratives are an easy tool that lets you spell out why you think QUALCOMM might be worth, say, US$300.00 per share or closer to US$191.80. You can then tie that story to a full forecast and a fair value that you can compare with today’s market price to help decide whether you see it as an opportunity to buy, hold, or sell.
Narratives are updated when new information such as QUALCOMM’s FY2025 results or analyst target changes come in, so your fair value view does not stay static. You can see how different investors, from those focused on Qualcomm’s FY2025 record revenue of US$11.7b and 24% EPS growth to those more cautious around its longer term diversification, reach very different conclusions about what the stock is worth.
Do you think there's more to the story for QUALCOMM? Head over to our Community to see what others are saying!

This article by Simply Wall St is general in nature. We provide commentary based on historical data and analyst forecasts only using an unbiased methodology and our articles are not intended to be financial advice. It does not constitute a recommendation to buy or sell any stock, and does not take account of your objectives, or your financial situation. We aim to bring you long-term focused analysis driven by fundamental data. Note that our analysis may not factor in the latest price-sensitive company announcements or qualitative material. Simply Wall St has no position in any stocks mentioned.
Have feedback on this article? Concerned about the content? Get in touch with us directly. Alternatively, email editorial-team@simplywallst.com