
 Nasdaq
 華爾街日報
華爾街日報Is Stanley Black & Decker (SWK) Pricing Reflect Recent Stabilisation Or Offer Longer Term Value?
- If you are wondering whether Stanley Black & Decker is offering fair value at around US$78.69, you are not alone. This article is here to break that question into clear, practical pieces.
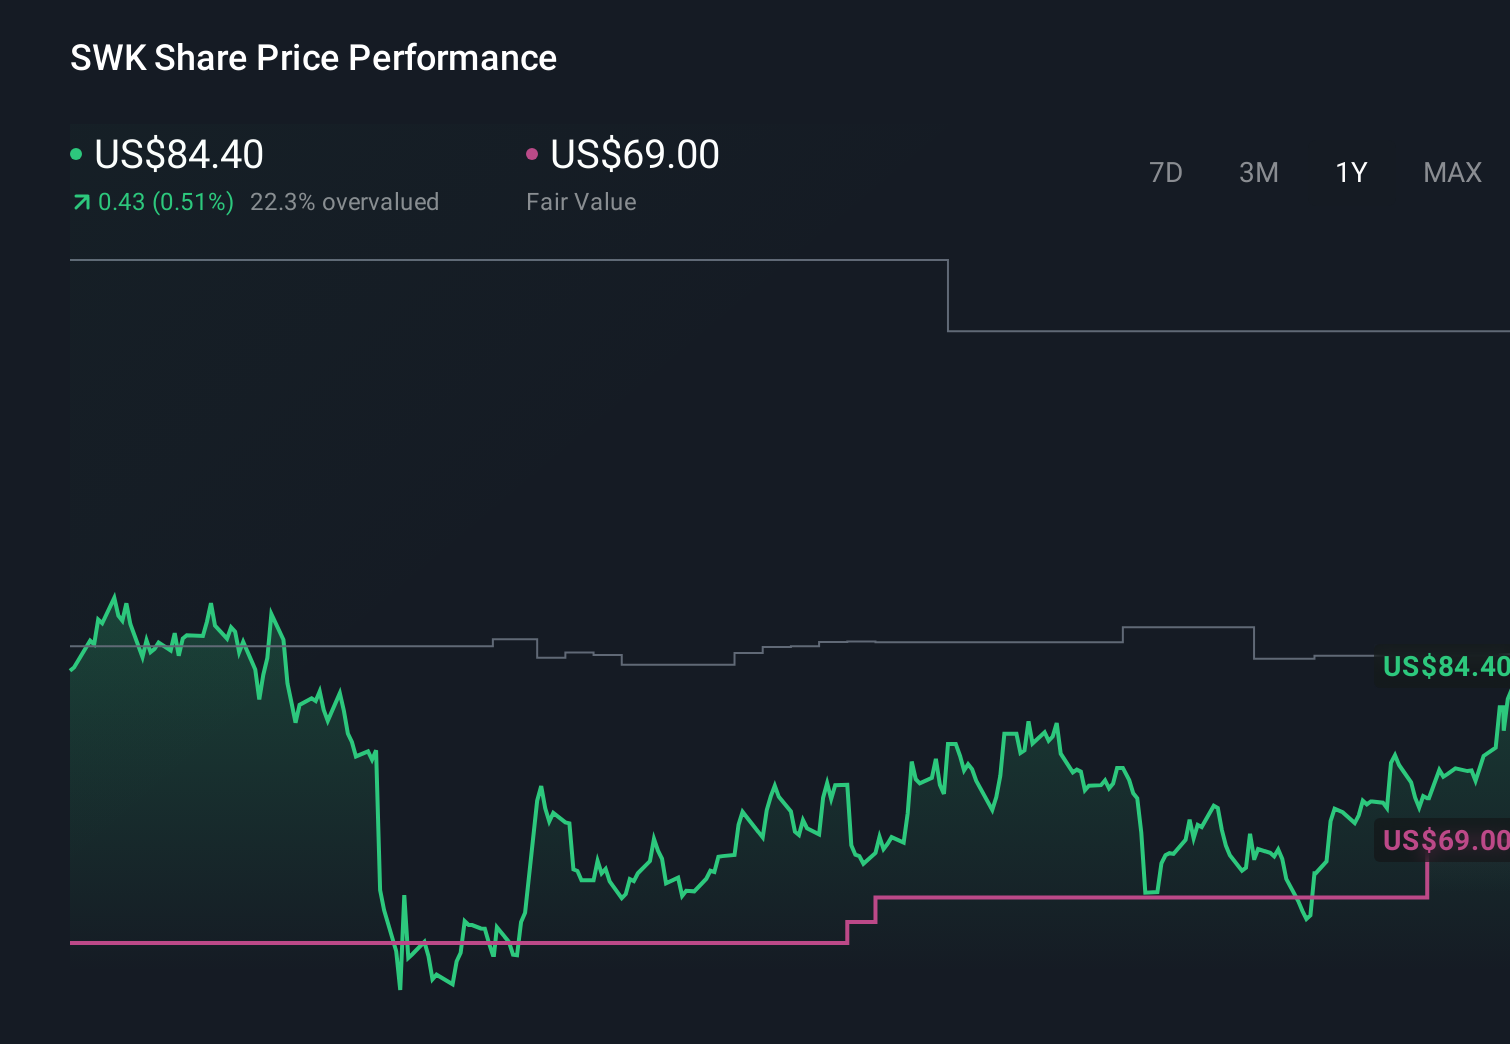
- The stock has returned 5.9% over the last 7 days, 8.7% over the last 30 days, 2.9% year to date and 1.0% over the last year, while the 3 year return is 3.2% and the 5 year return reflects a 46.5% decline.
- Recent coverage has focused on how investors are reassessing long term expectations for tool and industrial names like Stanley Black & Decker, with sentiment shifting as markets weigh past share price weakness against more recent stabilisation. This context helps explain why the stock’s shorter term returns differ from its longer term record, and why valuation is back in focus.
- Right now, Stanley Black & Decker scores 3 out of 6 on our valuation checks. Next, we will walk through the main valuation approaches investors often use, before finishing with a way of looking at value that can tie all of those pieces together.
Find out why Stanley Black & Decker's 1.0% return over the last year is lagging behind its peers.
Approach 1: Stanley Black & Decker Discounted Cash Flow (DCF) Analysis
A Discounted Cash Flow, or DCF, model takes expected future cash flows and discounts them back to what they might be worth today. For Stanley Black & Decker, the model used is a 2 Stage Free Cash Flow to Equity approach, based on cash flow projections in $.
The latest twelve month free cash flow is about $362.6 million. Analysts and model estimates project free cash flow rising to $1,592.0 million by 2028. Further projections out to 2035 are generated by Simply Wall St once analyst coverage tapers off. These ten year projections are then discounted and summed to estimate what the business could be worth in total today.
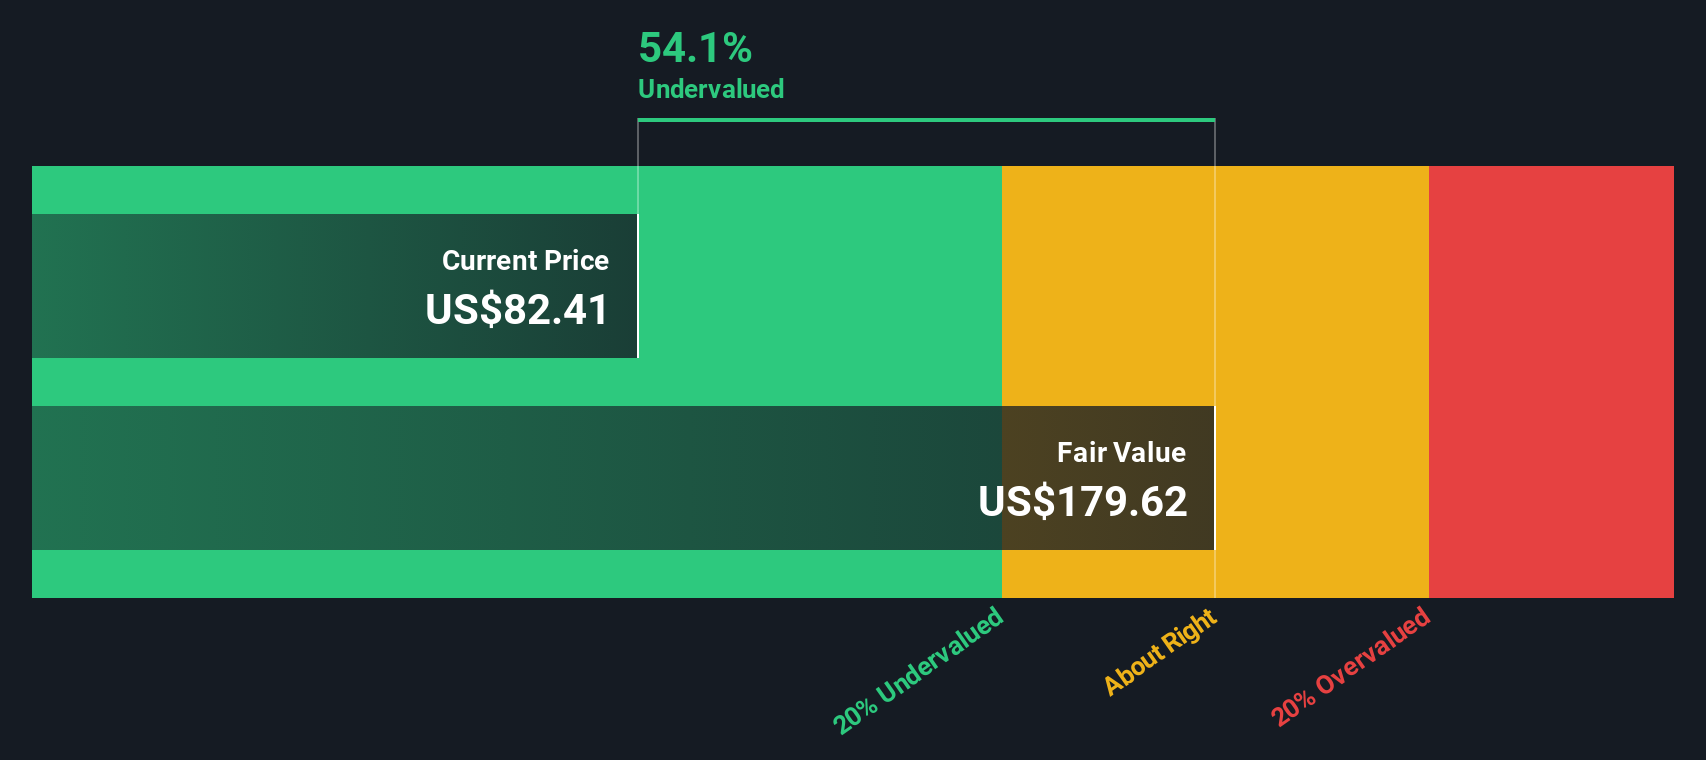
On this basis, the DCF model arrives at an estimated intrinsic value of about $178.65 per share. Against a current share price around $78.69, the model indicates that Stanley Black & Decker is trading at roughly a 56.0% discount to that intrinsic value. This suggests that the shares may be undervalued on this cash flow view.
Result: UNDERVALUED
Our Discounted Cash Flow (DCF) analysis suggests Stanley Black & Decker is undervalued by 56.0%. Track this in your watchlist or portfolio, or discover 885 more undervalued stocks based on cash flows.
Approach 2: Stanley Black & Decker Price vs Earnings
For a profitable business like Stanley Black & Decker, the P/E ratio is a useful shortcut because it links what you pay per share directly to the earnings the company is generating today.
What counts as a “normal” or “fair” P/E depends on how quickly earnings are expected to grow and how risky those earnings appear. Higher expected growth or lower perceived risk usually support a higher P/E, while slower growth or higher risk tend to justify a lower one.
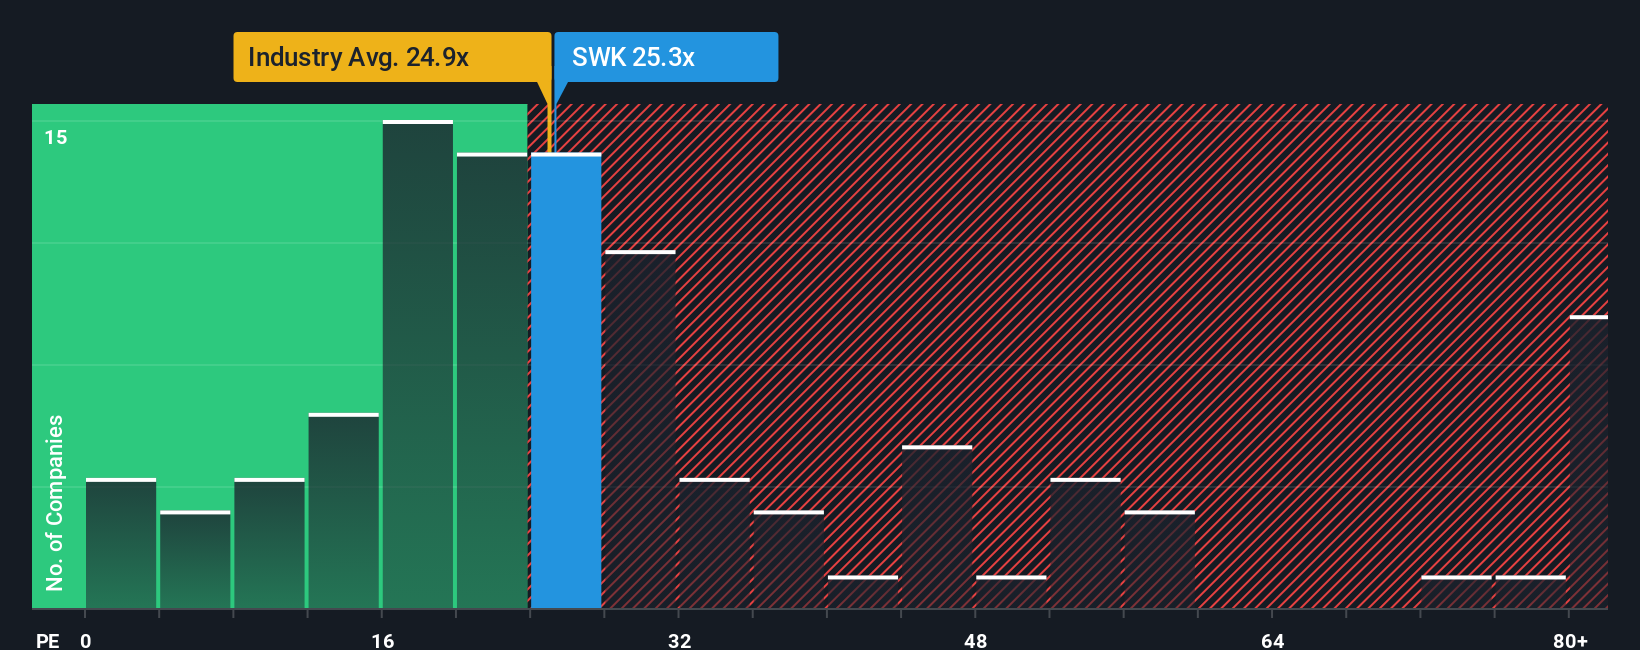
Stanley Black & Decker currently trades on a P/E of 27.79x. That sits slightly above the Machinery industry average of 25.97x and close to the peer group average of 27.14x. Simply Wall St also calculates a “Fair Ratio” of 43.93x, which estimates the P/E you might expect after factoring in elements such as earnings growth assumptions, the company’s industry, profit margins, market value and specific risks.
This Fair Ratio can be more tailored than a simple comparison with peers or the industry, because it adjusts for company specific characteristics rather than assuming all Machinery names deserve the same rating. With the current P/E of 27.79x below the Fair Ratio of 43.93x, this multiple based view indicates that the stock may be undervalued on an earnings basis.
Result: UNDERVALUED
P/E ratios tell one story, but what if the real opportunity lies elsewhere? Discover 1450 companies where insiders are betting big on explosive growth.
Upgrade Your Decision Making: Choose your Stanley Black & Decker Narrative
Earlier we mentioned that there is an even better way to understand valuation. On Simply Wall St’s Community page you can use Narratives, where you set a story for Stanley Black & Decker that connects your assumptions for future revenue, earnings and margins to a forecast and fair value. You can then compare that fair value with the current price to decide if the stock looks attractive or expensive, and see it update as new news or earnings arrive. This is why some investors might build a more optimistic story that supports a fair value near the higher analyst target of US$120.15, while others use the same tools to build a more cautious view closer to the lower target of US$64.00.
Do you think there's more to the story for Stanley Black & Decker? Head over to our Community to see what others are saying!
This article by Simply Wall St is general in nature. We provide commentary based on historical data and analyst forecasts only using an unbiased methodology and our articles are not intended to be financial advice. It does not constitute a recommendation to buy or sell any stock, and does not take account of your objectives, or your financial situation. We aim to bring you long-term focused analysis driven by fundamental data. Note that our analysis may not factor in the latest price-sensitive company announcements or qualitative material. Simply Wall St has no position in any stocks mentioned.
Have feedback on this article? Concerned about the content? Get in touch with us directly. Alternatively, email editorial-team@simplywallst.com