
 Nasdaq
 華爾街日報
華爾街日報Dynamic Design Co., LTD. (KRX:145210) Not Doing Enough For Some Investors As Its Shares Slump 25%
The Dynamic Design Co., LTD. (KRX:145210) share price has fared very poorly over the last month, falling by a substantial 25%. For any long-term shareholders, the last month ends a year to forget by locking in a 58% share price decline.
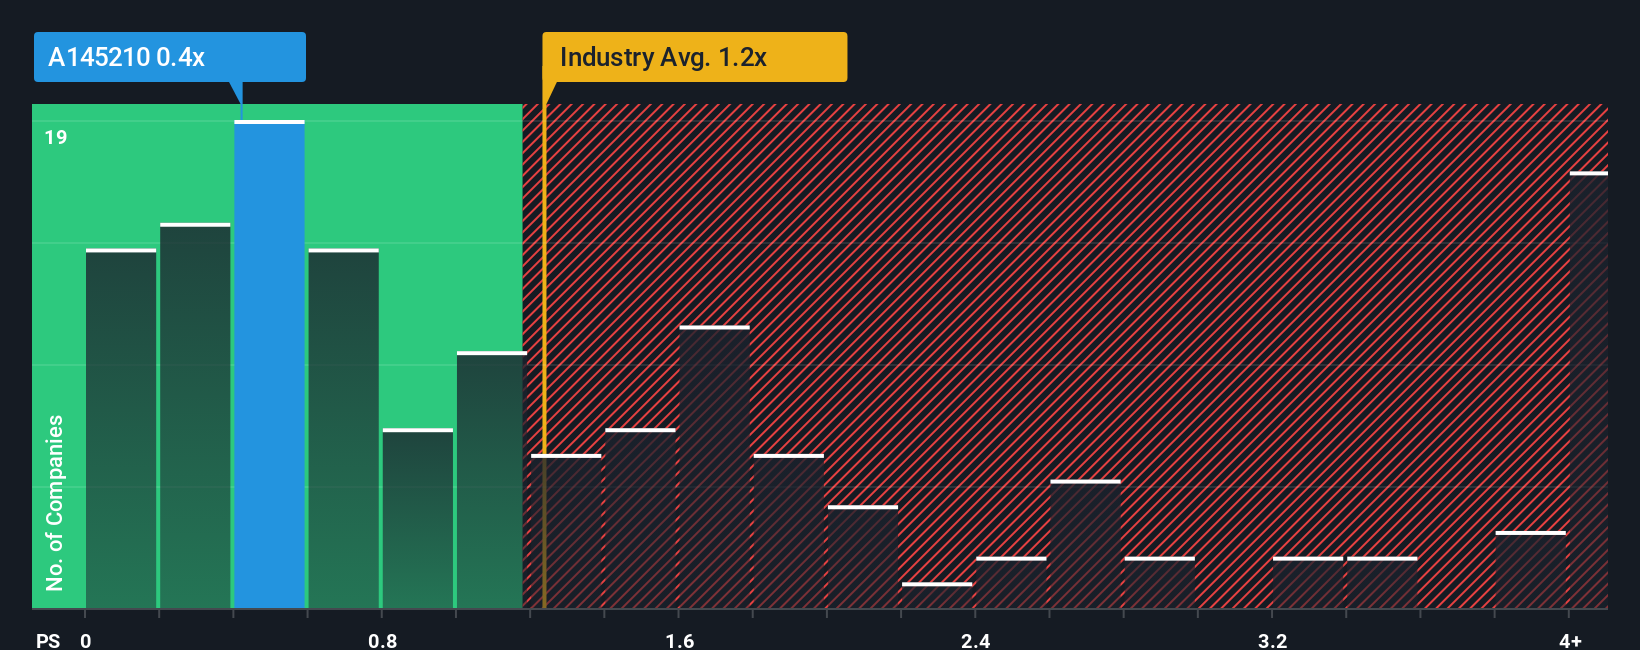
Since its price has dipped substantially, considering around half the companies operating in Korea's Machinery industry have price-to-sales ratios (or "P/S") above 1.2x, you may consider Dynamic Design as an solid investment opportunity with its 0.4x P/S ratio. Although, it's not wise to just take the P/S at face value as there may be an explanation why it's limited.
See our latest analysis for Dynamic Design
What Does Dynamic Design's Recent Performance Look Like?
Revenue has risen firmly for Dynamic Design recently, which is pleasing to see. It might be that many expect the respectable revenue performance to degrade substantially, which has repressed the P/S. If you like the company, you'd be hoping this isn't the case so that you could potentially pick up some stock while it's out of favour.
Want the full picture on earnings, revenue and cash flow for the company? Then our free report on Dynamic Design will help you shine a light on its historical performance.How Is Dynamic Design's Revenue Growth Trending?
There's an inherent assumption that a company should underperform the industry for P/S ratios like Dynamic Design's to be considered reasonable.
Taking a look back first, we see that the company grew revenue by an impressive 16% last year. As a result, it also grew revenue by 30% in total over the last three years. So we can start by confirming that the company has actually done a good job of growing revenue over that time.
Comparing the recent medium-term revenue trends against the industry's one-year growth forecast of 24% shows it's noticeably less attractive.
In light of this, it's understandable that Dynamic Design's P/S sits below the majority of other companies. Apparently many shareholders weren't comfortable holding on to something they believe will continue to trail the wider industry.
The Bottom Line On Dynamic Design's P/S
Dynamic Design's P/S has taken a dip along with its share price. Typically, we'd caution against reading too much into price-to-sales ratios when settling on investment decisions, though it can reveal plenty about what other market participants think about the company.
In line with expectations, Dynamic Design maintains its low P/S on the weakness of its recent three-year growth being lower than the wider industry forecast. At this stage investors feel the potential for an improvement in revenue isn't great enough to justify a higher P/S ratio. Unless the recent medium-term conditions improve, they will continue to form a barrier for the share price around these levels.
You need to take note of risks, for example - Dynamic Design has 3 warning signs (and 1 which is a bit unpleasant) we think you should know about.
It's important to make sure you look for a great company, not just the first idea you come across. So if growing profitability aligns with your idea of a great company, take a peek at this free list of interesting companies with strong recent earnings growth (and a low P/E).
Have feedback on this article? Concerned about the content? Get in touch with us directly. Alternatively, email editorial-team (at) simplywallst.com.
This article by Simply Wall St is general in nature. We provide commentary based on historical data and analyst forecasts only using an unbiased methodology and our articles are not intended to be financial advice. It does not constitute a recommendation to buy or sell any stock, and does not take account of your objectives, or your financial situation. We aim to bring you long-term focused analysis driven by fundamental data. Note that our analysis may not factor in the latest price-sensitive company announcements or qualitative material. Simply Wall St has no position in any stocks mentioned.