
 Nasdaq
 華爾街日報
華爾街日報A Look At The Fair Value Of Daiichi Kigenso Kagaku Kogyo Co., Ltd. (TSE:4082)
Key Insights
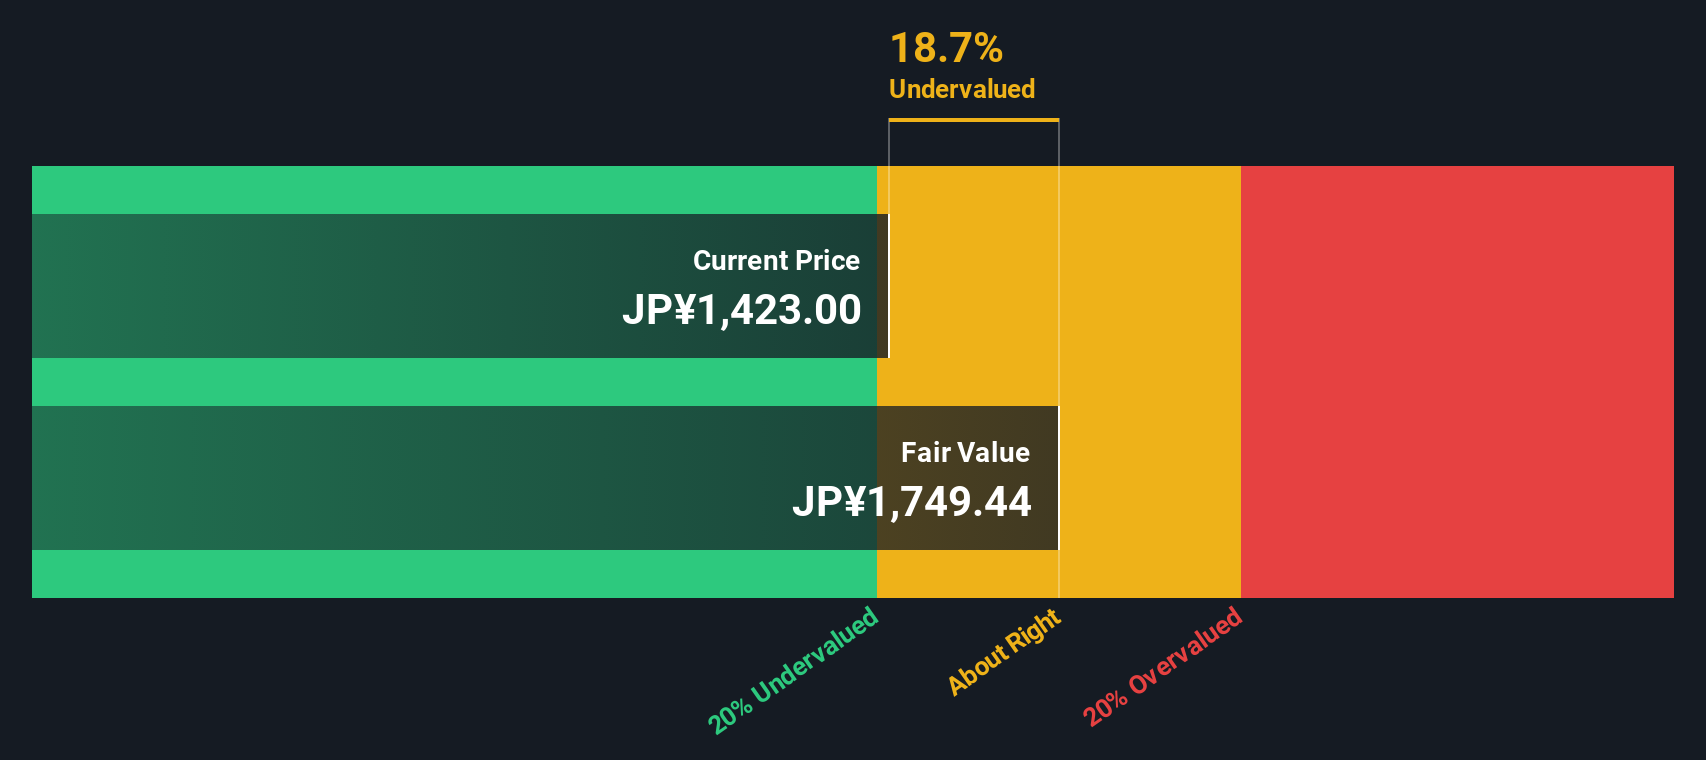
- Daiichi Kigenso Kagaku Kogyo's estimated fair value is JP¥1,749 based on 2 Stage Free Cash Flow to Equity
- With JP¥1,423 share price, Daiichi Kigenso Kagaku Kogyo appears to be trading close to its estimated fair value
- Peers of Daiichi Kigenso Kagaku Kogyo are currently trading on average at a 31% premium
In this article we are going to estimate the intrinsic value of Daiichi Kigenso Kagaku Kogyo Co., Ltd. (TSE:4082) by estimating the company's future cash flows and discounting them to their present value. Our analysis will employ the Discounted Cash Flow (DCF) model. Don't get put off by the jargon, the math behind it is actually quite straightforward.
Remember though, that there are many ways to estimate a company's value, and a DCF is just one method. If you still have some burning questions about this type of valuation, take a look at the Simply Wall St analysis model.
Crunching The Numbers
We're using the 2-stage growth model, which simply means we take in account two stages of company's growth. In the initial period the company may have a higher growth rate and the second stage is usually assumed to have a stable growth rate. To start off with, we need to estimate the next ten years of cash flows. Seeing as no analyst estimates of free cash flow are available to us, we have extrapolate the previous free cash flow (FCF) from the company's last reported value. We assume companies with shrinking free cash flow will slow their rate of shrinkage, and that companies with growing free cash flow will see their growth rate slow, over this period. We do this to reflect that growth tends to slow more in the early years than it does in later years.
A DCF is all about the idea that a dollar in the future is less valuable than a dollar today, and so the sum of these future cash flows is then discounted to today's value:
10-year free cash flow (FCF) forecast
| 2026 | 2027 | 2028 | 2029 | 2030 | 2031 | 2032 | 2033 | 2034 | 2035 | |
| Levered FCF (¥, Millions) | JP¥2.63b | JP¥2.59b | JP¥2.57b | JP¥2.56b | JP¥2.56b | JP¥2.56b | JP¥2.57b | JP¥2.58b | JP¥2.59b | JP¥2.60b |
| Growth Rate Estimate Source | Est @ -2.26% | Est @ -1.40% | Est @ -0.80% | Est @ -0.38% | Est @ -0.09% | Est @ 0.12% | Est @ 0.26% | Est @ 0.36% | Est @ 0.44% | Est @ 0.48% |
| Present Value (¥, Millions) Discounted @ 6.5% | JP¥2.5k | JP¥2.3k | JP¥2.1k | JP¥2.0k | JP¥1.9k | JP¥1.8k | JP¥1.7k | JP¥1.6k | JP¥1.5k | JP¥1.4k |
("Est" = FCF growth rate estimated by Simply Wall St)
Present Value of 10-year Cash Flow (PVCF) = JP¥19b
After calculating the present value of future cash flows in the initial 10-year period, we need to calculate the Terminal Value, which accounts for all future cash flows beyond the first stage. The Gordon Growth formula is used to calculate Terminal Value at a future annual growth rate equal to the 5-year average of the 10-year government bond yield of 0.6%. We discount the terminal cash flows to today's value at a cost of equity of 6.5%.
Terminal Value (TV)= FCF2035 × (1 + g) ÷ (r – g) = JP¥2.6b× (1 + 0.6%) ÷ (6.5%– 0.6%) = JP¥45b
Present Value of Terminal Value (PVTV)= TV / (1 + r)10= JP¥45b÷ ( 1 + 6.5%)10= JP¥24b
The total value is the sum of cash flows for the next ten years plus the discounted terminal value, which results in the Total Equity Value, which in this case is JP¥42b. To get the intrinsic value per share, we divide this by the total number of shares outstanding. Compared to the current share price of JP¥1.4k, the company appears about fair value at a 19% discount to where the stock price trades currently. Remember though, that this is just an approximate valuation, and like any complex formula - garbage in, garbage out.
The Assumptions
Now the most important inputs to a discounted cash flow are the discount rate, and of course, the actual cash flows. You don't have to agree with these inputs, I recommend redoing the calculations yourself and playing with them. The DCF also does not consider the possible cyclicality of an industry, or a company's future capital requirements, so it does not give a full picture of a company's potential performance. Given that we are looking at Daiichi Kigenso Kagaku Kogyo as potential shareholders, the cost of equity is used as the discount rate, rather than the cost of capital (or weighted average cost of capital, WACC) which accounts for debt. In this calculation we've used 6.5%, which is based on a levered beta of 1.119. Beta is a measure of a stock's volatility, compared to the market as a whole. We get our beta from the industry average beta of globally comparable companies, with an imposed limit between 0.8 and 2.0, which is a reasonable range for a stable business.
See our latest analysis for Daiichi Kigenso Kagaku Kogyo
SWOT Analysis for Daiichi Kigenso Kagaku Kogyo
- Debt is not viewed as a risk.
- Dividends are covered by earnings and cash flows.
- Dividend is low compared to the top 25% of dividend payers in the Chemicals market.
- Annual earnings are forecast to grow faster than the Japanese market.
- Current share price is below our estimate of fair value.
- No apparent threats visible for 4082.
Moving On:
Although the valuation of a company is important, it is only one of many factors that you need to assess for a company. It's not possible to obtain a foolproof valuation with a DCF model. Instead the best use for a DCF model is to test certain assumptions and theories to see if they would lead to the company being undervalued or overvalued. For example, changes in the company's cost of equity or the risk free rate can significantly impact the valuation. For Daiichi Kigenso Kagaku Kogyo, we've compiled three additional elements you should consider:
- Risks: We feel that you should assess the 3 warning signs for Daiichi Kigenso Kagaku Kogyo (1 is potentially serious!) we've flagged before making an investment in the company.
- Future Earnings: How does 4082's growth rate compare to its peers and the wider market? Dig deeper into the analyst consensus number for the upcoming years by interacting with our free analyst growth expectation chart.
- Other High Quality Alternatives: Do you like a good all-rounder? Explore our interactive list of high quality stocks to get an idea of what else is out there you may be missing!
PS. The Simply Wall St app conducts a discounted cash flow valuation for every stock on the TSE every day. If you want to find the calculation for other stocks just search here.
Have feedback on this article? Concerned about the content? Get in touch with us directly. Alternatively, email editorial-team (at) simplywallst.com.
This article by Simply Wall St is general in nature. We provide commentary based on historical data and analyst forecasts only using an unbiased methodology and our articles are not intended to be financial advice. It does not constitute a recommendation to buy or sell any stock, and does not take account of your objectives, or your financial situation. We aim to bring you long-term focused analysis driven by fundamental data. Note that our analysis may not factor in the latest price-sensitive company announcements or qualitative material. Simply Wall St has no position in any stocks mentioned.