
 Nasdaq
 華爾街日報
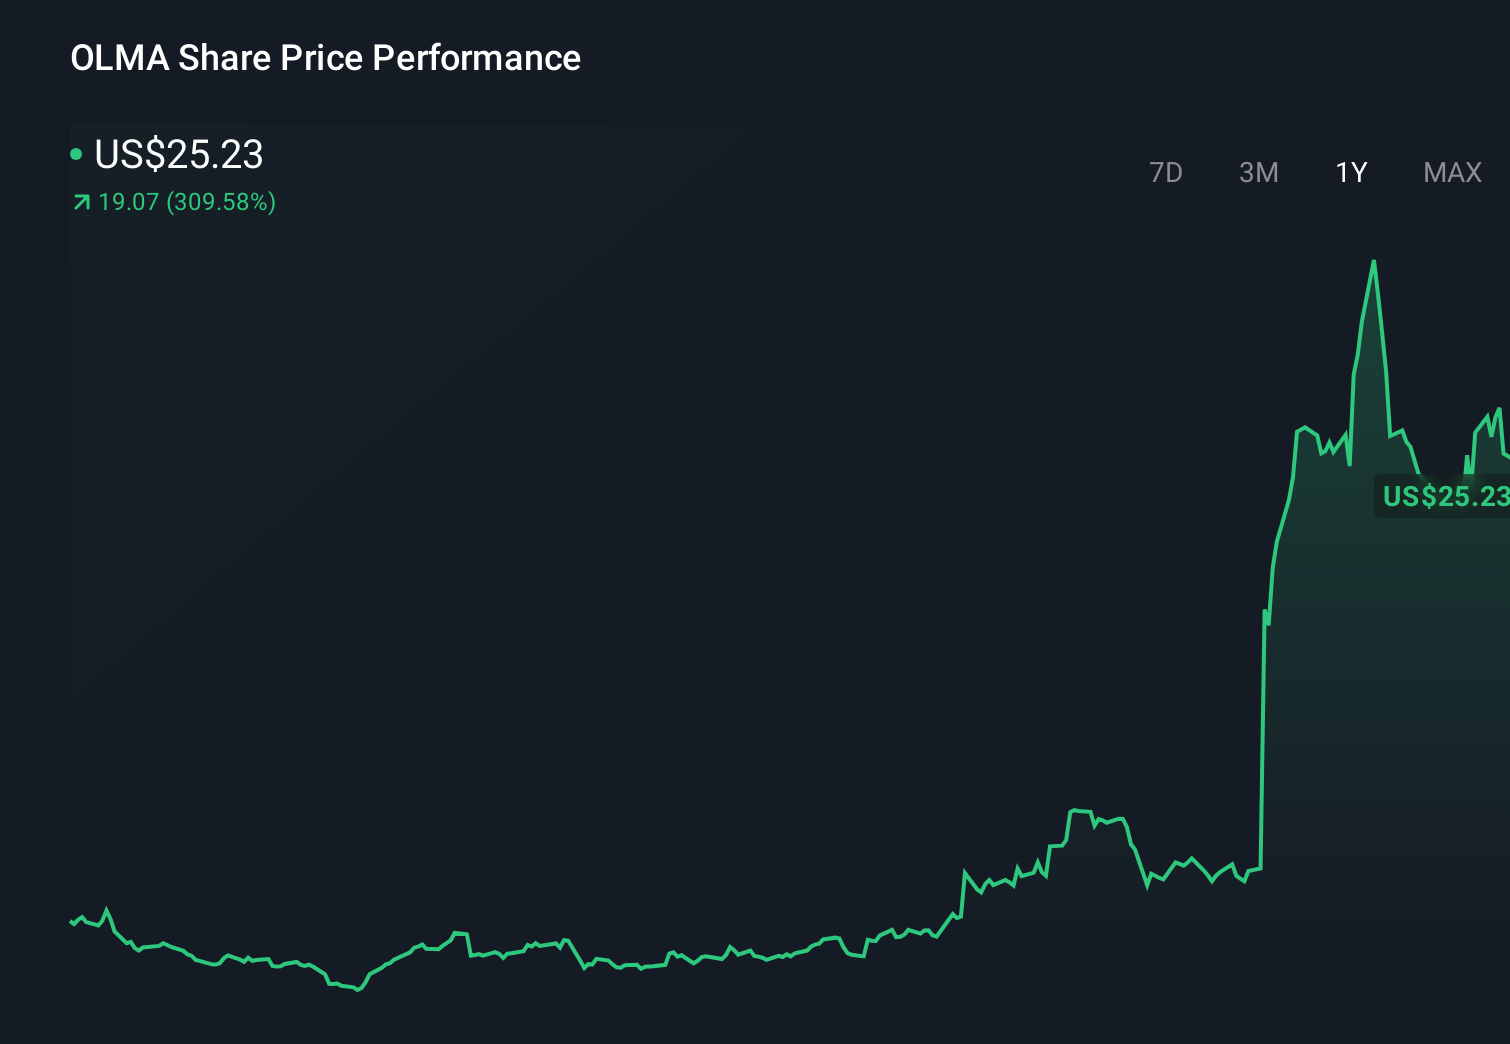
華爾街日報Is It Time To Reassess Olema Pharmaceuticals (OLMA) After Its 335% One Year Surge?
- If you are wondering whether Olema Pharmaceuticals at around US$25.04 is offering fair value today, you are not alone; this article is set up to help you weigh what that price might actually represent.
- The stock has had a very large 1 year return of 335.5%. However, the last 30 days show a 10.5% decline and the year to date return sits around 0.9%, which can change how investors think about both upside and risk.
- Recent headlines around Olema have focused on its position within the pharmaceuticals and biotech space and how the market is reacting to its progress on key programs. This helps explain why sentiment has been strong over the past year. These updates give useful context for the sharp move in the share price and set the backdrop for thinking about what a reasonable valuation might look like today.
- Right now, Olema scores 1 out of 6 on our valuation checks, which you can see in detail in the valuation score. Next, we will compare this with several common valuation approaches, before finishing with a framework that can help you think about valuation in an even more complete way.
Olema Pharmaceuticals scores just 1/6 on our valuation checks. See what other red flags we found in the full valuation breakdown.
Approach 1: Olema Pharmaceuticals Discounted Cash Flow (DCF) Analysis
A Discounted Cash Flow, or DCF, model projects a company’s future cash flows and then discounts them back to today’s value to estimate what the business could be worth right now.
For Olema Pharmaceuticals, the model used is a 2 Stage Free Cash Flow to Equity approach. The latest twelve month free cash flow is a loss of $134.7 million, and analyst and extrapolated projections keep free cash flow in negative territory for several years, with estimates such as $206.6 million in 2026 and $230.6 million in 2027. The projections then move to a positive free cash flow of $52.1 million in 2030. Beyond the analyst horizon, Simply Wall St extrapolates further free cash flow figures through 2035 based on these inputs.
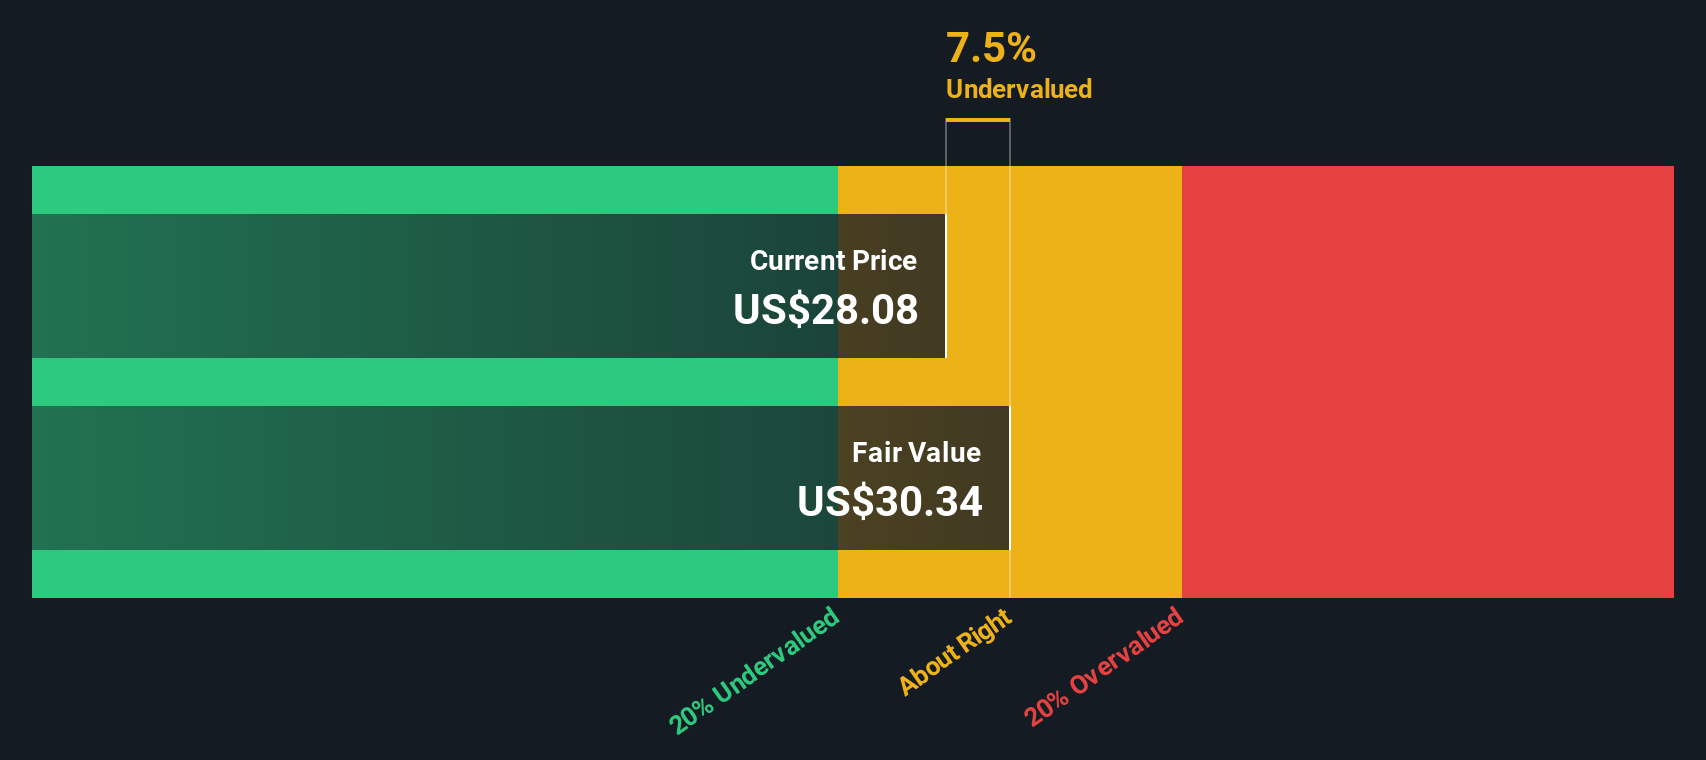
When all those projected cash flows are discounted back using this DCF model, the estimated intrinsic value comes out at about $30.26 per share. Against a recent price around $25.04, that implies Olema trades at roughly a 17.3% discount to this DCF estimate, which suggests the shares are undervalued on this model.
Result: UNDERVALUED
Our Discounted Cash Flow (DCF) analysis suggests Olema Pharmaceuticals is undervalued by 17.3%. Track this in your watchlist or portfolio, or discover 877 more undervalued stocks based on cash flows.
Approach 2: Olema Pharmaceuticals Price vs Book
For companies that are still loss making, earnings based metrics such as the P/E ratio are less useful, so investors often look at asset based measures like the Price to Book, or P/B, ratio instead. This compares the market value of the company with the accounting value of its net assets, which can be a more grounded anchor when profits are not yet in place.
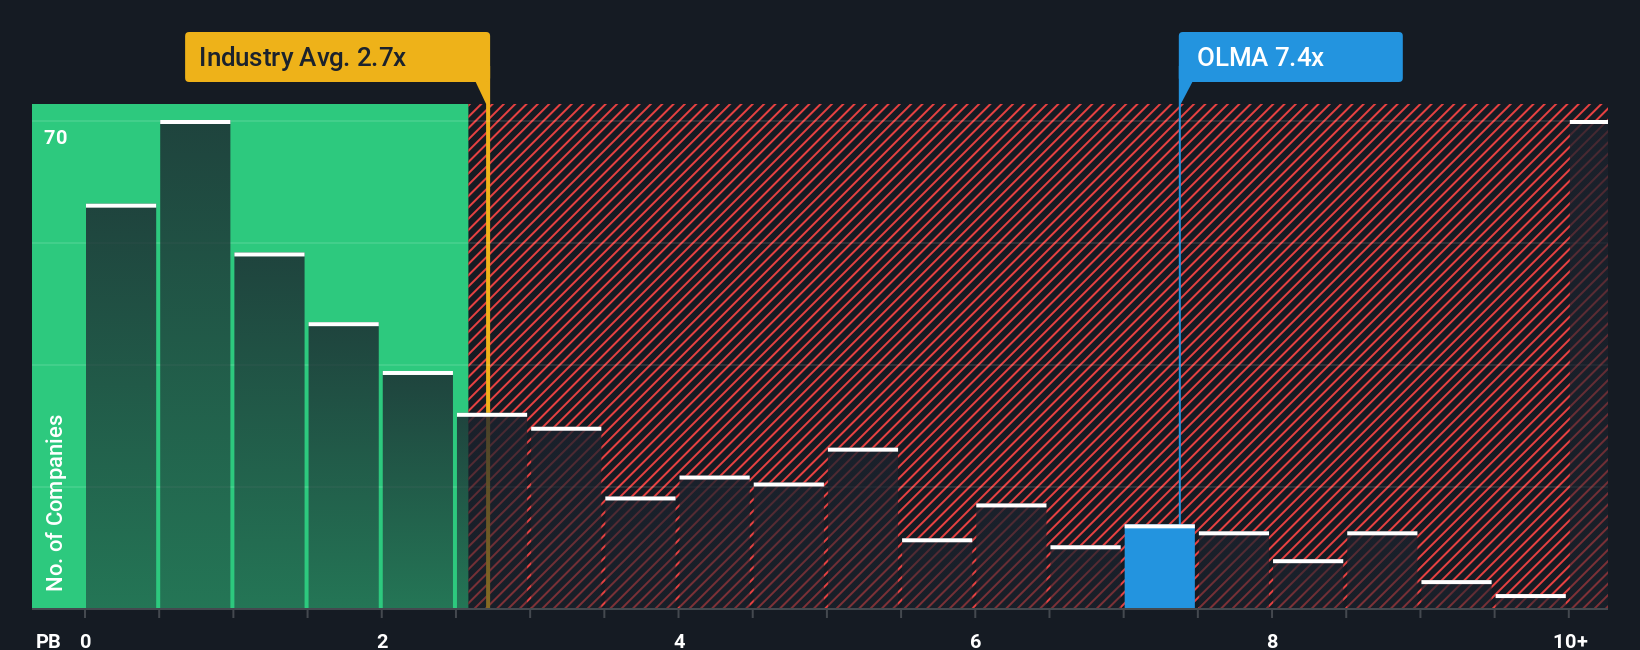
Growth expectations and risk still matter here, because a higher growth outlook or lower perceived risk can justify a higher P/B multiple, while slower growth or higher risk can align with a lower, more conservative P/B. Olema Pharmaceuticals currently trades on a P/B of about 6.41x, compared with the Biotechs industry average of around 2.67x and a peer average of roughly 5.02x.
Simply Wall St’s Fair Ratio is a proprietary view of what an appropriate P/B could be, given factors such as earnings growth, industry, profit margins, market cap and company specific risks. This tailored measure can be more informative than a simple comparison with peers or the wider industry, because it adjusts for the company’s own profile rather than assuming all biotechs deserve similar multiples. In this case there is no Fair Ratio available, so it is not possible to say whether the current 6.41x P/B looks overvalued, undervalued, or about right on this framework.
Result: ABOUT RIGHT
P/B ratios tell one story, but what if the real opportunity lies elsewhere? Discover 1450 companies where insiders are betting big on explosive growth.
Upgrade Your Decision Making: Choose your Olema Pharmaceuticals Narrative
Earlier we mentioned that there is an even better way to understand valuation, so let us introduce you to Narratives, a simple way to connect your view of Olema Pharmaceuticals with the numbers behind it. A Narrative is your story about the company, linked directly to a financial forecast and then to a fair value, so you are not just looking at a P/B or DCF in isolation; you are seeing how your assumptions about future revenue, earnings and margins translate into a price you think is reasonable. On Simply Wall St, Narratives sit inside the Community page and are used by millions of investors, giving you an accessible tool to compare your fair value with the current market price and decide whether the gap between the two feels like an opportunity or a warning. As new information such as news or earnings comes in, these Narratives update so your view stays aligned with the latest data instead of going stale. For example, one Olema Narrative might lean on a higher fair value based on optimistic pipeline outcomes, while another might use a far lower fair value that reflects a more cautious stance on clinical and funding risks.
Do you think there's more to the story for Olema Pharmaceuticals? Head over to our Community to see what others are saying!
This article by Simply Wall St is general in nature. We provide commentary based on historical data and analyst forecasts only using an unbiased methodology and our articles are not intended to be financial advice. It does not constitute a recommendation to buy or sell any stock, and does not take account of your objectives, or your financial situation. We aim to bring you long-term focused analysis driven by fundamental data. Note that our analysis may not factor in the latest price-sensitive company announcements or qualitative material. Simply Wall St has no position in any stocks mentioned.
Have feedback on this article? Concerned about the content? Get in touch with us directly. Alternatively, email editorial-team@simplywallst.com