
 Nasdaq
 華爾街日報
華爾街日報Is BlackBerry (TSX:BB) Pricing Reflect Its Software Transition And Mixed Valuation Signals?
- If you are wondering whether BlackBerry's share price still reflects its true worth, you are not alone; many investors are asking the same question right now.
- The stock recently closed at $5.42, with a 4.4% gain over the last 7 days, a 9.2% decline over 30 days, a 3.8% gain year to date, a 7.0% decline over 1 year, a 10.6% gain over 3 years, and a 44.0% decline over 5 years.
- These mixed returns have come alongside ongoing attention on BlackBerry's shift toward software and cybersecurity, as the company continues to move away from its legacy hardware roots. This backdrop helps explain why sentiment can swing quickly as investors reassess what the business is worth.
- On our checks, BlackBerry has a valuation score of 1 out of 6. The rest of this article will walk through the main valuation approaches used to reach that number, before finishing with a broader way of thinking about what the stock could be worth.
BlackBerry scores just 1/6 on our valuation checks. See what other red flags we found in the full valuation breakdown.
Approach 1: BlackBerry Discounted Cash Flow (DCF) Analysis
A Discounted Cash Flow model takes estimates of the cash a company could generate in the future and discounts those amounts back to what they may be worth today. It is essentially asking what a rational buyer might pay today for all those future cash flows in $.
For BlackBerry, the model starts with last twelve month free cash flow of about $31.4 million and a set of ten year projections that reach an estimated free cash flow of $136 million in 2030. Analyst inputs cover the earlier years and the later years are extrapolated using Simply Wall St's approach, all expressed in $ and then discounted back using a 2 Stage Free Cash Flow to Equity framework.
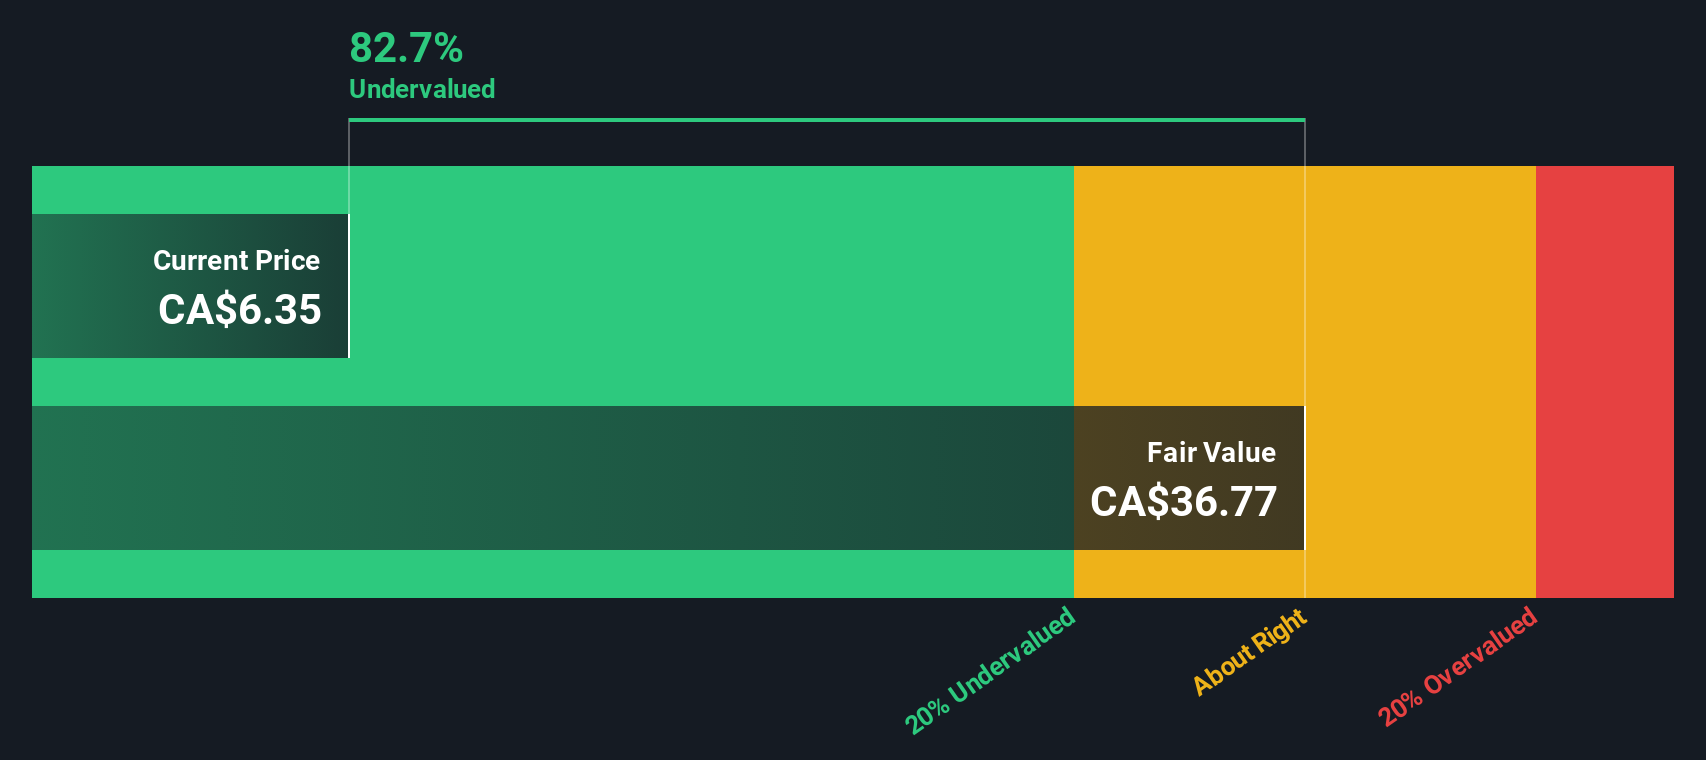
Putting those discounted projections together, the model arrives at an estimated intrinsic value of $6.21 per share. Compared with the recent share price of CA$5.42, this implies the stock is about 12.8% below that estimate, which points to a degree of undervaluation on this DCF view.
Result: UNDERVALUED
Our Discounted Cash Flow (DCF) analysis suggests BlackBerry is undervalued by 12.8%. Track this in your watchlist or portfolio, or discover 875 more undervalued stocks based on cash flows.
Approach 2: BlackBerry Price vs Earnings
For a company that is generating earnings, the P/E ratio is a common way to think about what you are paying for each dollar of profit. Investors usually accept a higher P/E if they expect stronger growth or see lower risk, while slower growth or higher risk often goes with a lower, more conservative multiple.
BlackBerry currently trades on a P/E of 109.8x. That compares with the broader Software industry average of 47.3x and a peer group average of 54.0x, so the stock is on a higher multiple than both of those benchmarks.
Simply Wall St also calculates a “Fair Ratio” for BlackBerry of 35.3x. This is a proprietary estimate of what a reasonable P/E could be for the company based on factors such as its earnings growth profile, industry, profit margins, market cap and specific risks. Because it blends these company specific inputs rather than only comparing simple averages, the Fair Ratio can offer a more tailored reference point than looking at peers or the industry in isolation. Set against this Fair Ratio, BlackBerry’s current P/E suggests the shares are pricing in more optimism than that framework implies.
Result: OVERVALUED

P/E ratios tell one story, but what if the real opportunity lies elsewhere? Discover 1449 companies where insiders are betting big on explosive growth.
Upgrade Your Decision Making: Choose your BlackBerry Narrative
Earlier we mentioned that there is an even better way to understand valuation, so let us introduce you to Narratives, which are simply your story about a company linked directly to your own numbers for fair value, future revenue, earnings and margins.
Instead of only looking at ratios like P/E in isolation, a Narrative on Simply Wall St connects what you believe about BlackBerry’s business, for example its software focus or competitive position, to a financial forecast and then to a fair value that you can compare with today’s share price. This can help you decide whether you prefer to buy, hold or sell.
Narratives live inside the Community page on Simply Wall St, where millions of investors share and update them. They refresh automatically when new information comes in such as earnings releases or major news, so your fair value view can adjust as the story changes.
For BlackBerry, one investor might build a Narrative that expects stronger revenue growth and higher margins and arrives at a fair value well above the current price. Another investor might assume slower growth and more modest profitability and end up with a fair value well below the current price.
Do you think there's more to the story for BlackBerry? Head over to our Community to see what others are saying!

This article by Simply Wall St is general in nature. We provide commentary based on historical data and analyst forecasts only using an unbiased methodology and our articles are not intended to be financial advice. It does not constitute a recommendation to buy or sell any stock, and does not take account of your objectives, or your financial situation. We aim to bring you long-term focused analysis driven by fundamental data. Note that our analysis may not factor in the latest price-sensitive company announcements or qualitative material. Simply Wall St has no position in any stocks mentioned.
Have feedback on this article? Concerned about the content? Get in touch with us directly. Alternatively, email editorial-team@simplywallst.com