
 Nasdaq
 華爾街日報
華爾街日報Is Exxon Mobil (XOM) Offering Value After Strong Five Year Share Price Performance?
- If you have ever wondered whether Exxon Mobil's share price is really offering fair value today, you are not alone. This article is built to help you size that up clearly.
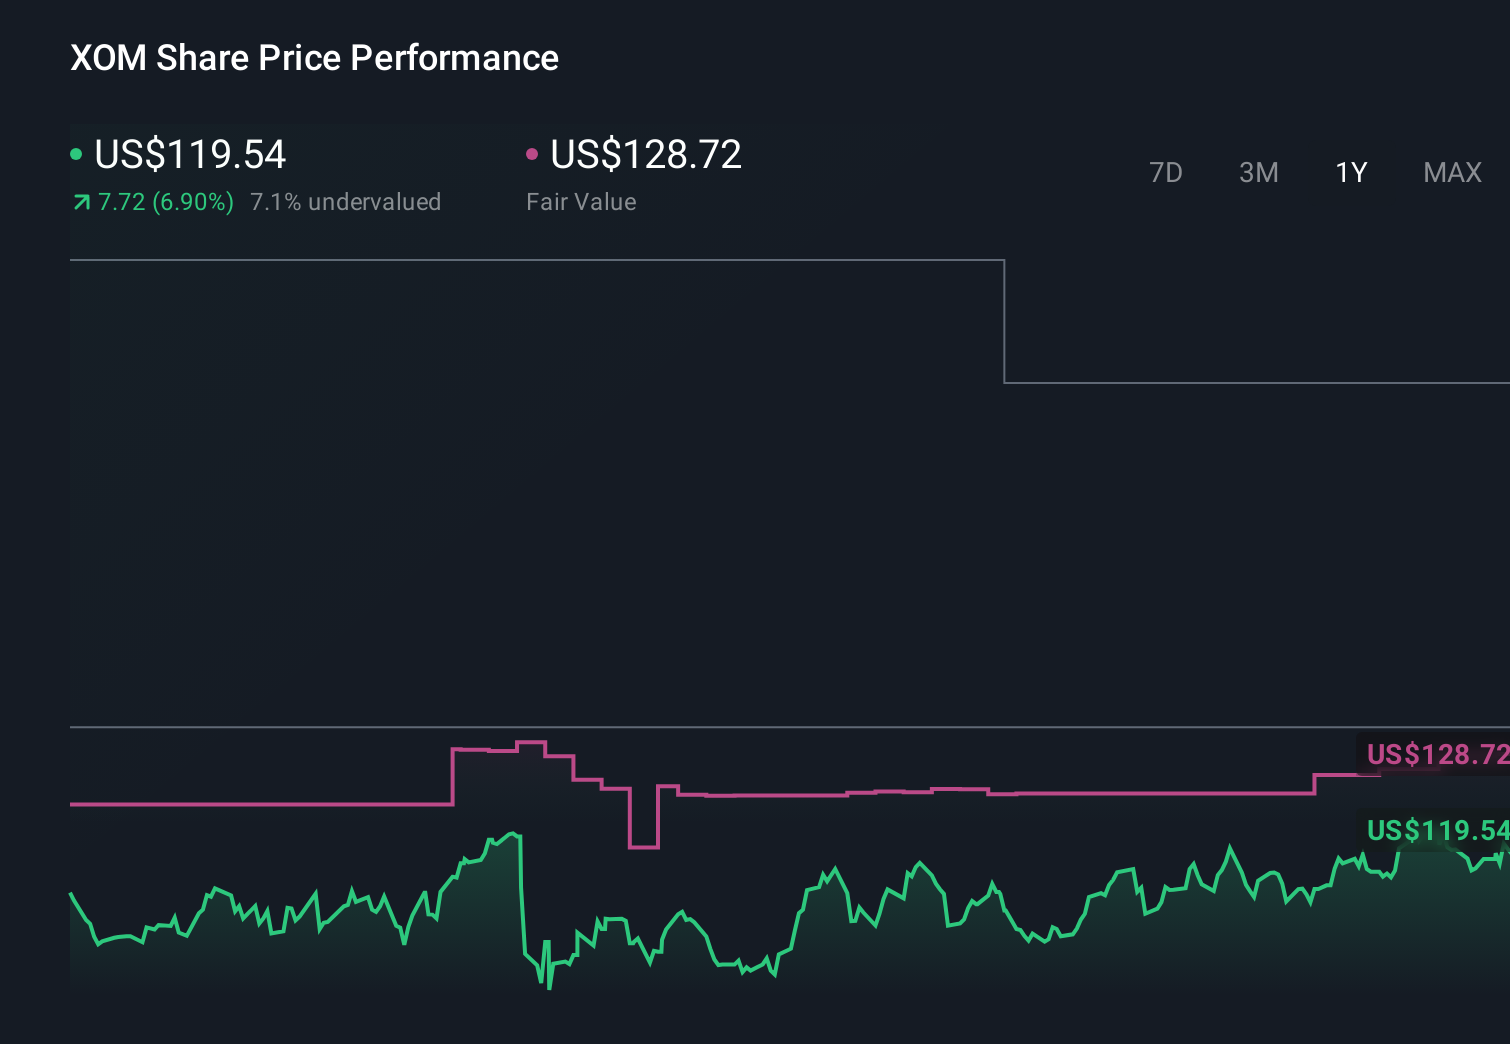
- The stock last closed at US$121.05, with returns of 0.0% over 7 days, 3.9% over 30 days, a 1.3% decline year to date, and 15.4% over the last year, with a very large 5 year return that sits a long way above 500%.
- Recent market interest in Exxon Mobil has been shaped by ongoing conversations about large integrated energy companies and their role in the global energy mix. These discussions help frame how investors think about both the risks and the potential of companies like Exxon Mobil when prices move.
- On our checks, Exxon Mobil scores 4/6 on valuation. You can see the full breakdown of that value score. Next, we will walk through the traditional valuation tools behind that score, then finish with a way of looking at valuation that can give you a fuller picture than ratios alone.
Approach 1: Exxon Mobil Discounted Cash Flow (DCF) Analysis
A Discounted Cash Flow, or DCF, model estimates what a company might be worth today by projecting its future cash flows and then discounting those back into current dollars. It is essentially asking what all of Exxon Mobil’s future cash generation could be worth in today’s terms.
For Exxon Mobil, the latest twelve month Free Cash Flow is about US$28.1b. The model used here is a 2 Stage Free Cash Flow to Equity approach, which relies on analyst estimates for the next few years and then extends those projections further out. By 2030, projected Free Cash Flow is US$37.4b, with interim annual figures between 2026 and 2035 based on a mix of analyst inputs and extrapolations.
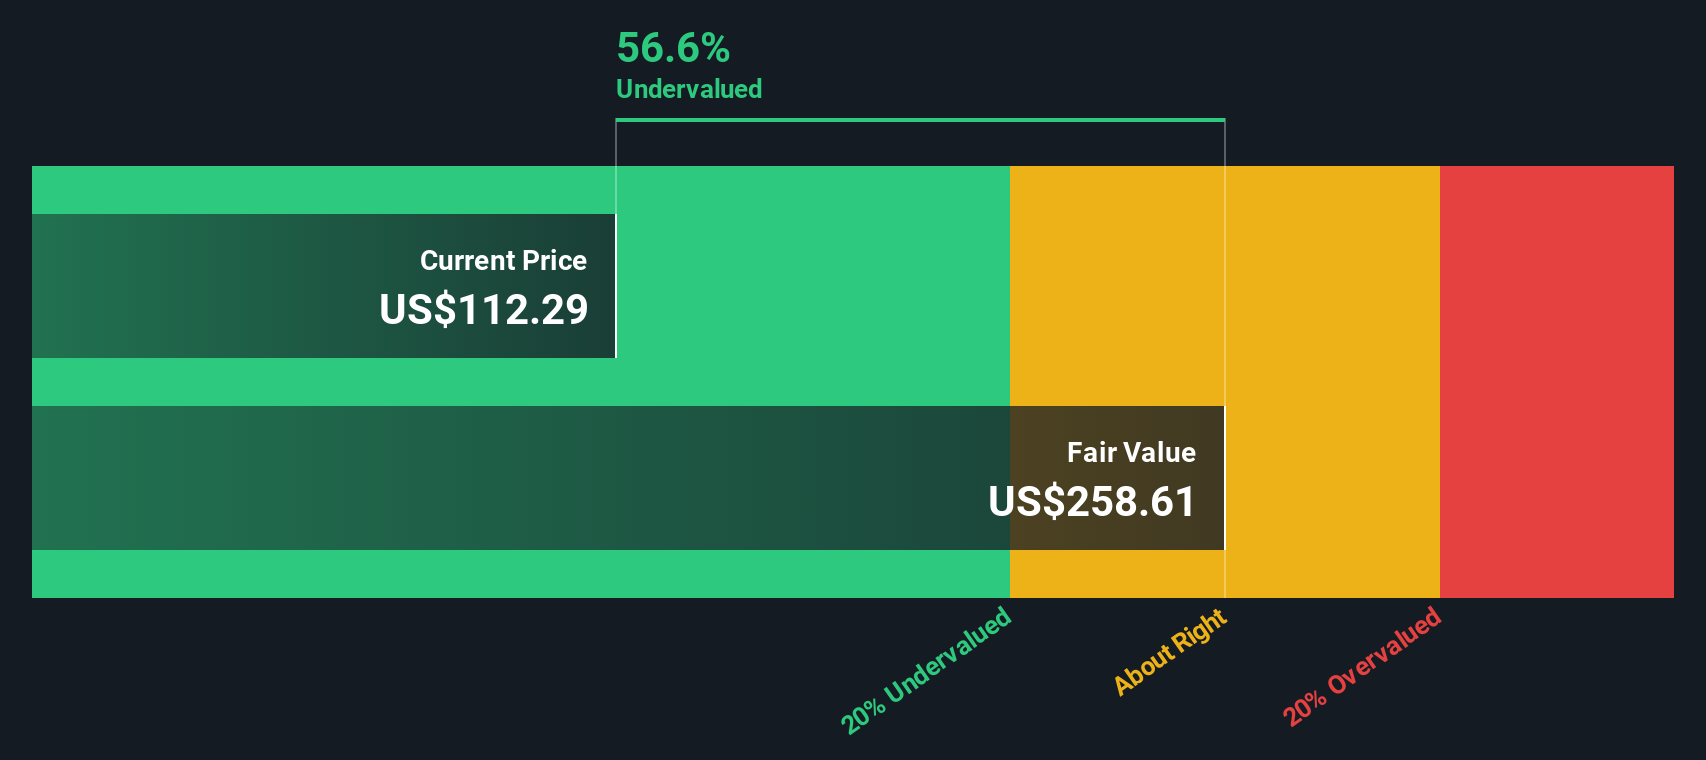
When all these projected cash flows are discounted back to today using the DCF method, the estimated intrinsic value comes out at US$182.63 per share. Compared with the recent share price of US$121.05, this implies the stock is 33.7% undervalued on this model.
Result: UNDERVALUED
Our Discounted Cash Flow (DCF) analysis suggests Exxon Mobil is undervalued by 33.7%. Track this in your watchlist or portfolio, or discover 878 more undervalued stocks based on cash flows.
Approach 2: Exxon Mobil Price vs Earnings
For a profitable business like Exxon Mobil, the P/E ratio is a useful way to see what you are paying for each dollar of earnings. It gives a quick sense of how the market is weighing the company’s earnings profile compared with other options.
What counts as a “normal” or “fair” P/E depends on how investors view a company’s growth prospects and risk. Higher expected earnings growth or lower perceived risk can support a higher P/E. Slower growth or higher risk usually lines up with a lower P/E.
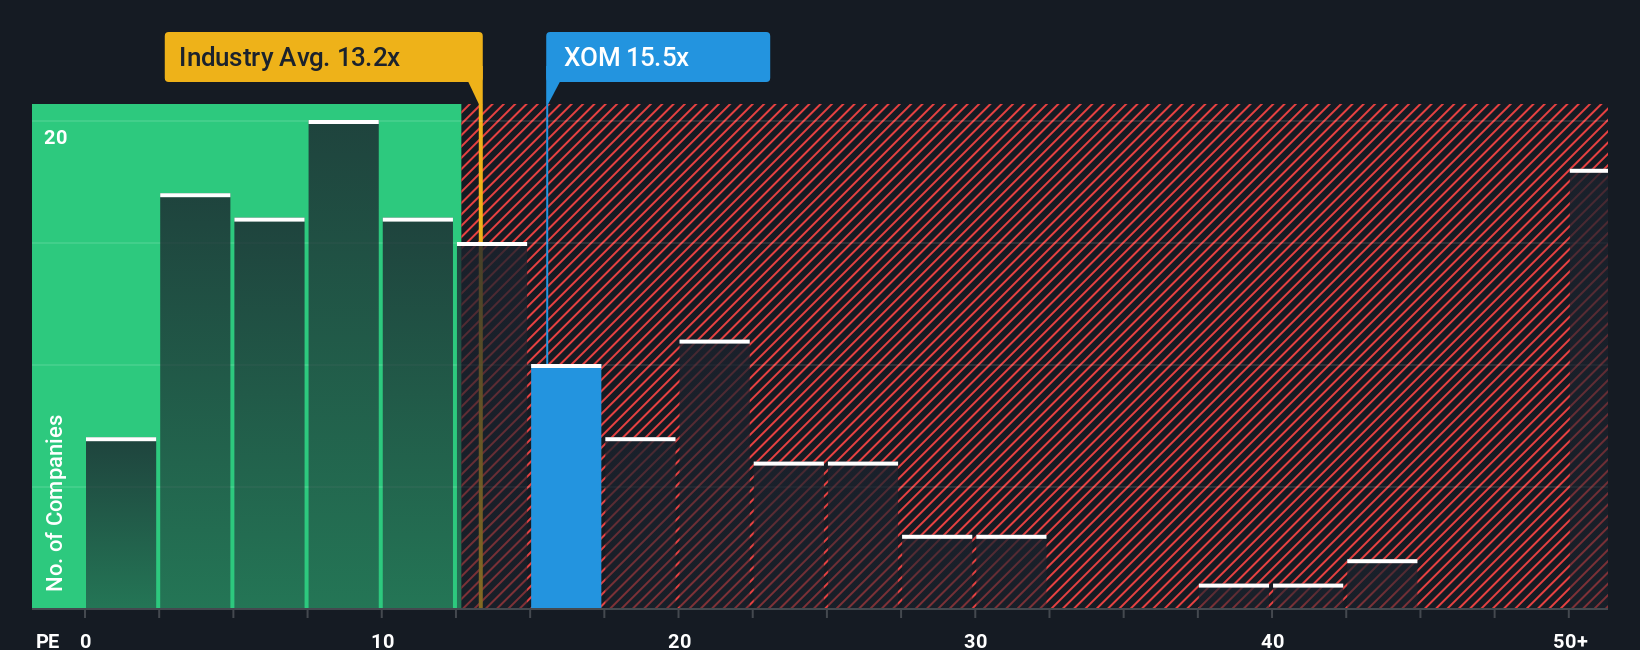
Exxon Mobil currently trades on a P/E of 17.0x. That is above the Oil and Gas industry average of 13.1x, but below the peer group average of 24.3x. Simply Wall St’s “Fair Ratio” for Exxon Mobil is 24.5x, which is its proprietary estimate of what the P/E could be given factors such as earnings growth, industry, profit margins, market cap and key risks.
This Fair Ratio can be more informative than a simple comparison with peers or the industry, because it adjusts for the company’s specific growth profile, risk traits and financial quality. Compared with the current 17.0x P/E, the 24.5x Fair Ratio suggests the shares trade below this modelled fair level.
Result: UNDERVALUED
P/E ratios tell one story, but what if the real opportunity lies elsewhere? Discover 1447 companies where insiders are betting big on explosive growth.
Upgrade Your Decision Making: Choose your Exxon Mobil Narrative
Earlier we mentioned that there is an even better way to understand valuation. Let us introduce Narratives, which are simple stories you create about Exxon Mobil that connect your view of its future revenue, earnings and margins to a financial forecast, a fair value, and then a clear comparison with today’s share price. This all happens within an accessible tool on Simply Wall St’s Community page that updates automatically when new news or earnings arrive. One investor might, for example, set a fair value of US$95.00 based on a more cautious outlook. Another might use US$174.00 or even US$189.00 based on a more optimistic view of projects like Guyana and capital returns. This shows you in one place how different perspectives on the same company translate into different fair values and potential buy or sell decisions.
Do you think there's more to the story for Exxon Mobil? Head over to our Community to see what others are saying!
This article by Simply Wall St is general in nature. We provide commentary based on historical data and analyst forecasts only using an unbiased methodology and our articles are not intended to be financial advice. It does not constitute a recommendation to buy or sell any stock, and does not take account of your objectives, or your financial situation. We aim to bring you long-term focused analysis driven by fundamental data. Note that our analysis may not factor in the latest price-sensitive company announcements or qualitative material. Simply Wall St has no position in any stocks mentioned.
Have feedback on this article? Concerned about the content? Get in touch with us directly. Alternatively, email editorial-team@simplywallst.com