
 Nasdaq
 華爾街日報
華爾街日報Is It Time To Reassess Uber Technologies (UBER) After The Recent 30 Day Share Price Pullback
- If you are wondering whether Uber Technologies stock still offers value at around US$85.54 per share, it helps to look closely at what the current price might already be assuming about its future.
- The share price has returned 4.2% over the last 7 days, after a 6.3% decline over the last 30 days, and it currently sits on a 29.3% return over 1 year and 205.1% over 3 years.
- Recent news has focused on Uber’s push to deepen its mobility and delivery footprint, as well as ongoing attention on ride sharing demand and regulatory conditions in key markets. This backdrop gives useful context when you compare the recent 30 day pullback with the stronger multi year share price performance.
- On Simply Wall St’s 6 point valuation framework, Uber Technologies currently scores 6 out of 6. Next we will look at how different valuation methods treat the stock, before finishing with a way of thinking about value that goes beyond any single model.
Approach 1: Uber Technologies Discounted Cash Flow (DCF) Analysis
A Discounted Cash Flow, or DCF, model takes estimates of a company’s future cash flows and discounts them back to today using a required rate of return. The goal is to translate all those future dollars into a single present value per share.
For Uber Technologies, the model used is a 2 Stage Free Cash Flow to Equity approach, based on cash flow projections. The company’s last twelve month free cash flow is reported at about $8.66b. Analyst and extrapolated estimates then project free cash flow of $19.33b in 2030, with a full ten year path of forecast and extrapolated figures between 2026 and 2035 provided in the model.
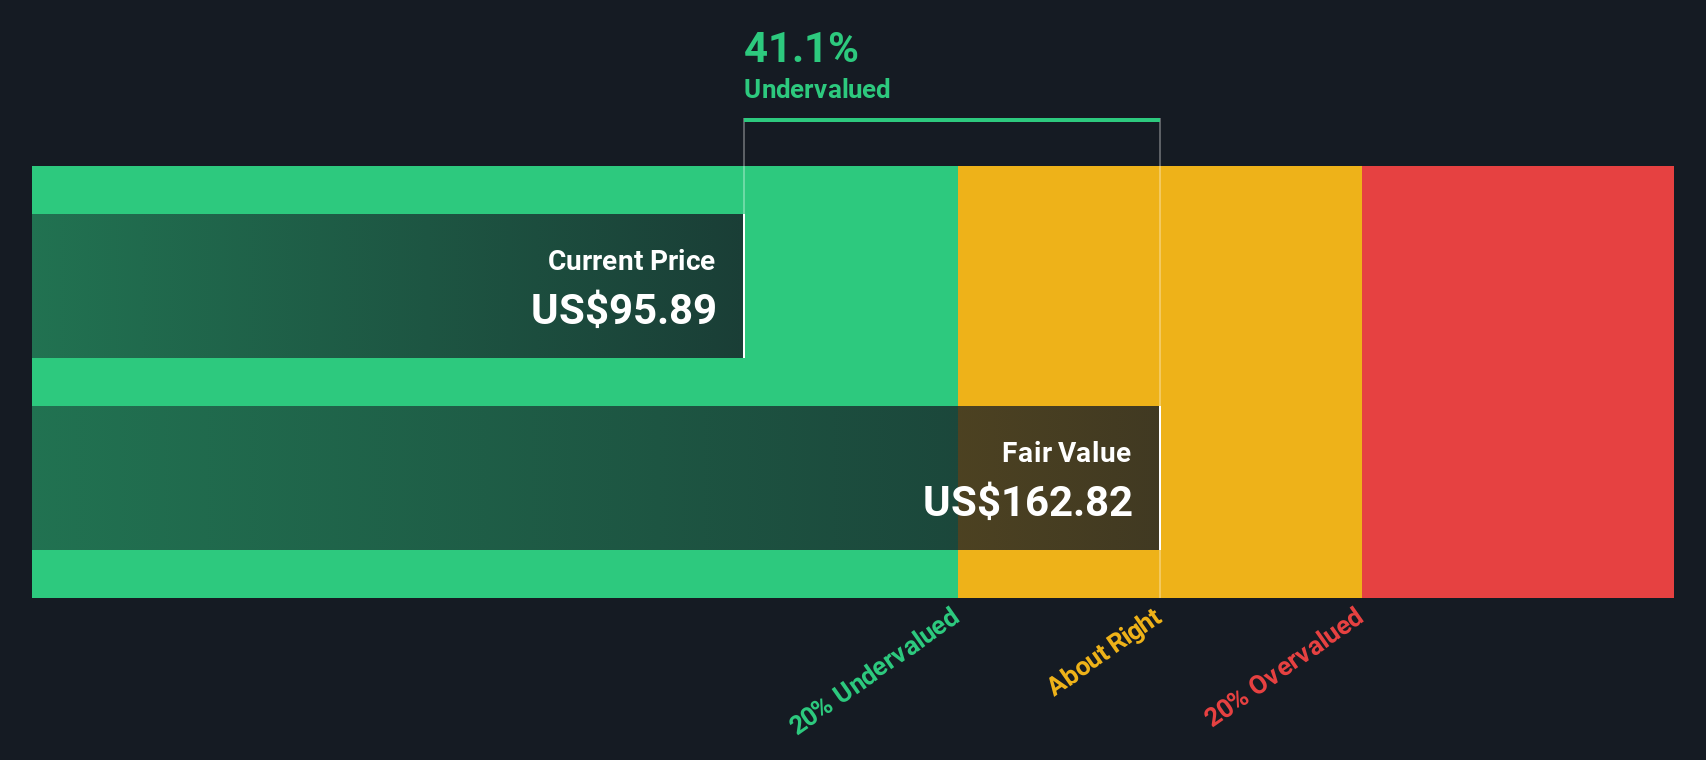
Using these inputs, Simply Wall St’s DCF calculation arrives at an estimated intrinsic value of US$192.82 per share. Compared with the recent share price of around US$85.54, this implies the stock is 55.6% undervalued according to this model.
Result: UNDERVALUED
Our Discounted Cash Flow (DCF) analysis suggests Uber Technologies is undervalued by 55.6%. Track this in your watchlist or portfolio, or discover 877 more undervalued stocks based on cash flows.
Approach 2: Uber Technologies Price vs Earnings
For a company that is generating earnings, the P/E ratio is a useful way to see how much you are paying for each dollar of profit. It is simple, widely used and directly links the share price to the company’s bottom line.
What counts as a “normal” P/E depends on how investors view the company’s growth outlook and risk. Higher growth and perceived resilience often justify a higher P/E, while more uncertainty or weaker growth expectations tend to be linked with a lower P/E.
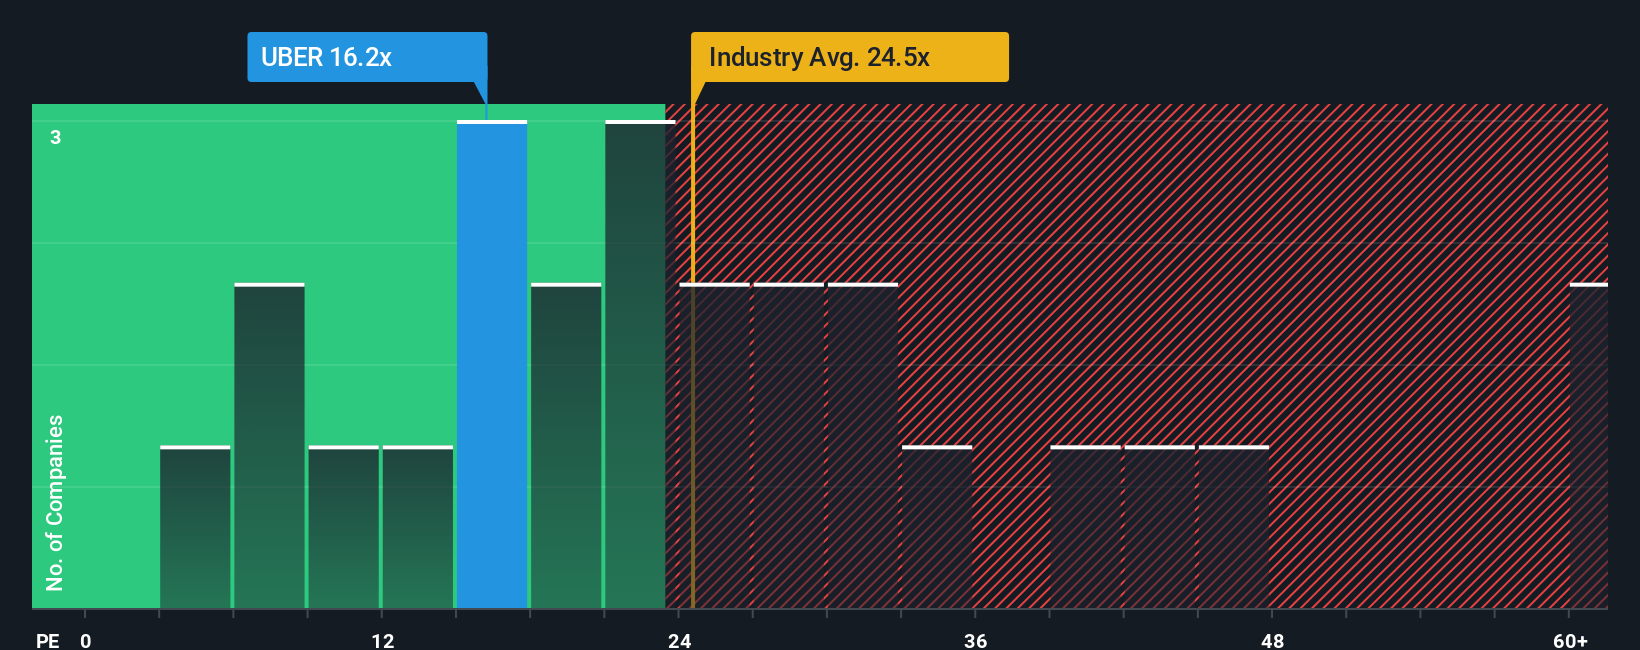
Uber Technologies currently trades on a P/E of 10.68x, compared with the Transportation industry average of about 33.40x and a peer average of 67.99x. Simply Wall St also calculates a proprietary “Fair Ratio” of 16.36x for Uber Technologies. This is the P/E level it might trade on given factors such as earnings growth, profit margins, industry, market cap and specific risks.
This Fair Ratio can be more informative than a simple comparison with peers or the industry because it adjusts for company specific characteristics instead of assuming that all businesses deserve the same multiple. With Uber Technologies at 10.68x compared with a Fair Ratio of 16.36x, the P/E based view suggests the shares are pricing in a lower multiple than this framework implies.
Result: UNDERVALUED
P/E ratios tell one story, but what if the real opportunity lies elsewhere? Discover 1448 companies where insiders are betting big on explosive growth.
Upgrade Your Decision Making: Choose your Uber Technologies Narrative
Earlier we mentioned that there is an even better way to understand valuation. On Simply Wall St’s Community page you can use Narratives, where you tell a clear story for Uber Technologies, link that story to your own revenue, earnings and margin assumptions, and roll those into a Fair Value. You can then see in real time how that stacks up against the current share price, with Narratives updating when new news or earnings arrive. For example, you can see one Uber narrative that assumes a Fair Value around US$75 per share based on revenue of US$65b to US$70b by 2030 and an EBITDA margin of about 22% with a future P/E of 14.57x. Another narrative on the same company assumes a Fair Value around US$112.06 per share with revenue growth of 14.56%, a profit margin near 13.96% and a future P/E of 27.74x. This shows how two investors can look at the same business, plug in very different forecasts, and reach different conclusions on whether the current price looks high or low.
For Uber Technologies, here are previews of two leading Uber Technologies Narratives to make comparison easier:
Fair value in this narrative: US$112.06
Gap to that fair value versus the recent US$85.54 price: about 24% below the narrative fair value
Revenue growth assumption: 14.56% a year
- Expects user growth, cross platform engagement and products like Uber One to support higher spending per customer and help margins over time.
- Builds in a long term role for autonomous vehicles, electrification and higher margin services such as advertising to support profit growth.
- Relies on analysts’ expectations for revenue, earnings and a future P/E of about 27.74x, with risks around autonomous vehicle timing, competition, regulation and lower margin products.
Fair value in this narrative: US$75.00
Gap to that fair value versus the recent US$85.54 price: about 14% above the narrative fair value
Revenue growth assumption: 4.2% a year
- Uses a future earnings and P/E approach and assumes 2030 revenue of about US$65b to US$70b with EBITDA of roughly US$14b to US$15b at a 22% margin.
- Compares that to a fair value range of about US$90b to US$135b in market cap, which is below the current US$192b figure used in the narrative.
- States that the price around US$95 at the time of the narrative was rich and highlights a preferred entry range of US$65 to US$75 per share.
These two frameworks use different growth and valuation assumptions, which is why they arrive at very different answers on what looks reasonable for Uber Technologies today. If you build your own view on earnings, margins and the multiple you think is appropriate, you can judge which narrative is closer to how you see the company.
Curious how numbers become stories that shape markets? Explore Community Narratives
Do you think there's more to the story for Uber Technologies? Head over to our Community to see what others are saying!

This article by Simply Wall St is general in nature. We provide commentary based on historical data and analyst forecasts only using an unbiased methodology and our articles are not intended to be financial advice. It does not constitute a recommendation to buy or sell any stock, and does not take account of your objectives, or your financial situation. We aim to bring you long-term focused analysis driven by fundamental data. Note that our analysis may not factor in the latest price-sensitive company announcements or qualitative material. Simply Wall St has no position in any stocks mentioned.
Have feedback on this article? Concerned about the content? Get in touch with us directly. Alternatively, email editorial-team@simplywallst.com