
 Nasdaq
 華爾街日報
華爾街日報Is It Too Late To Consider Evercore (EVR) After A 38% One Year Rally?
- For readers wondering whether Evercore's share price still offers value after a strong run, this article walks through what the current market price might be implying about the business.
- The stock last closed at US$374.02, with returns of 8.8% over 7 days, 12.8% over 30 days, 6.5% year to date and 37.8% over 1 year. The 3 year return is very large and the 5 year return is also very large.
- Recent coverage around Evercore has focused on its role as a major independent advisory firm and its positioning in capital markets. These topics often influence investor sentiment and trading activity. Broader commentary on the sector has also highlighted how deal pipelines, financing conditions and corporate activity can affect expectations around advisory businesses like Evercore.
- Evercore scores 1 out of 6 on our valuation checks. Next we will look at traditional methods such as multiples and cash flow based models, then finish with a framework that can help you interpret these valuation signals in a more complete way.
Evercore scores just 1/6 on our valuation checks. See what other red flags we found in the full valuation breakdown.
Approach 1: Evercore Excess Returns Analysis
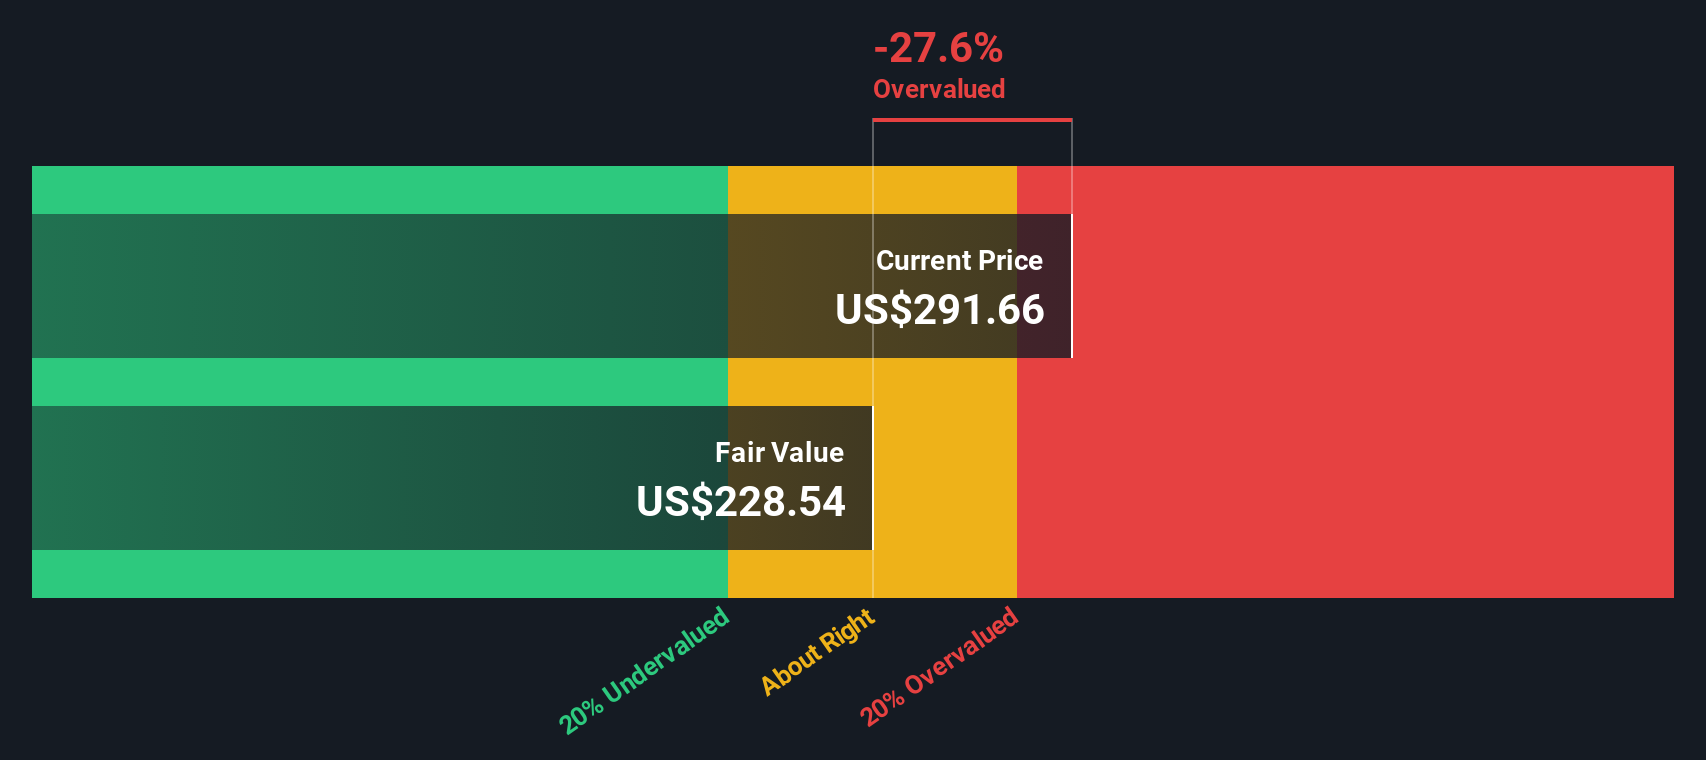
The Excess Returns model looks at how much value Evercore may create over and above the return that shareholders are assumed to require. It starts from what the company can earn on its equity and compares that with its cost of equity.
For Evercore, book value is $46.93 per share and the stable book value used in the model is $61.31 per share, based on weighted future book value estimates from 3 analysts. The model assumes stable EPS of $22.01 per share, sourced from weighted future return on equity estimates from 4 analysts.
The cost of equity is set at $5.07 per share, which implies an excess return of $16.94 per share. That excess is supported by an average return on equity of 35.90%, which is materially higher than the assumed required return. These inputs are then capitalised to estimate an intrinsic value of about $399.05 per share.
Against the recent share price of US$374.02, this Excess Returns estimate points to roughly a 6.3% discount, which is small and could reasonably be seen as within a normal range of uncertainty.
Result: ABOUT RIGHT
Evercore is fairly valued according to our Excess Returns, but this can change at a moment's notice. Track the value in your watchlist or portfolio and be alerted on when to act.
Approach 2: Evercore Price vs Earnings
For a profitable company like Evercore, the P/E ratio is a straightforward way to connect the share price with the earnings that support it. It helps you see how many dollars the market is currently willing to pay for each dollar of earnings.
What counts as a normal or fair P/E depends on what investors expect for growth and how much risk they see in the business. Higher expected growth or lower perceived risk can justify a higher P/E, while lower growth or higher risk usually points to a lower multiple.
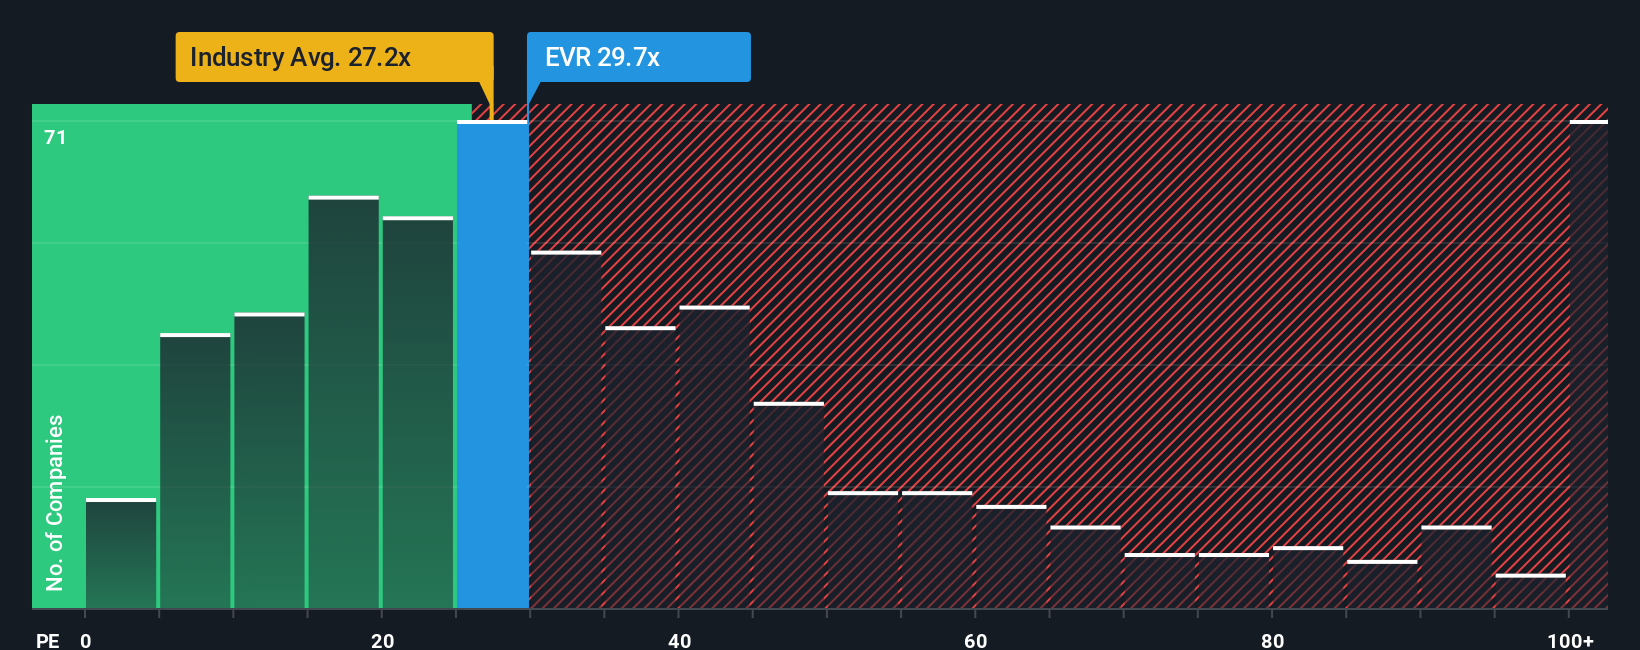
Evercore currently trades on a P/E of 27.38x, compared with the Capital Markets industry average of 25.75x and a peer average of 20.70x. Simply Wall St’s Fair Ratio for Evercore is 17.34x. This Fair Ratio is a proprietary estimate of what the P/E might be, given factors like earnings growth, industry, profit margin, market cap and risk characteristics. That makes it more tailored than a simple comparison with peers or the broad industry, which may have very different profiles.
With a current P/E of 27.38x versus a Fair Ratio of 17.34x, Evercore’s valuation screens as higher than what the Fair Ratio implies.
Result: OVERVALUED
P/E ratios tell one story, but what if the real opportunity lies elsewhere? Discover 1448 companies where insiders are betting big on explosive growth.
Upgrade Your Decision Making: Choose your Evercore Narrative
Earlier we mentioned that there is an even better way to understand valuation, so let us introduce you to Narratives. These let you attach a clear story about Evercore to the numbers by linking your view of its future revenue, earnings and margins to a financial forecast, a Fair Value, and then a simple comparison with today’s price. All of this happens within the Simply Wall St Community page, where Narratives are updated automatically when new news or earnings arrive. For example, one investor might build a Narrative that leans into expansion, diversification and technology investment to justify a Fair Value around the current analyst consensus of US$364.20. Another might focus more on competition, compensation costs and M&A cyclicality to arrive at a lower Fair Value closer to the current community estimate of about US$353.56. This gives you a clear, easy framework to decide whether the current US$374.02 share price looks high, low or about right for your own story.
Do you think there's more to the story for Evercore? Head over to our Community to see what others are saying!

This article by Simply Wall St is general in nature. We provide commentary based on historical data and analyst forecasts only using an unbiased methodology and our articles are not intended to be financial advice. It does not constitute a recommendation to buy or sell any stock, and does not take account of your objectives, or your financial situation. We aim to bring you long-term focused analysis driven by fundamental data. Note that our analysis may not factor in the latest price-sensitive company announcements or qualitative material. Simply Wall St has no position in any stocks mentioned.
Have feedback on this article? Concerned about the content? Get in touch with us directly. Alternatively, email editorial-team@simplywallst.com