
 Nasdaq
 華爾街日報
華爾街日報Is Boston Scientific (BSX) Pricing In Too Much Growth After Strong Multi‑Year Share Gains
- If you are wondering whether Boston Scientific's current share price reflects its true value, this breakdown will help you see what the market might be pricing in and what it could be overlooking.
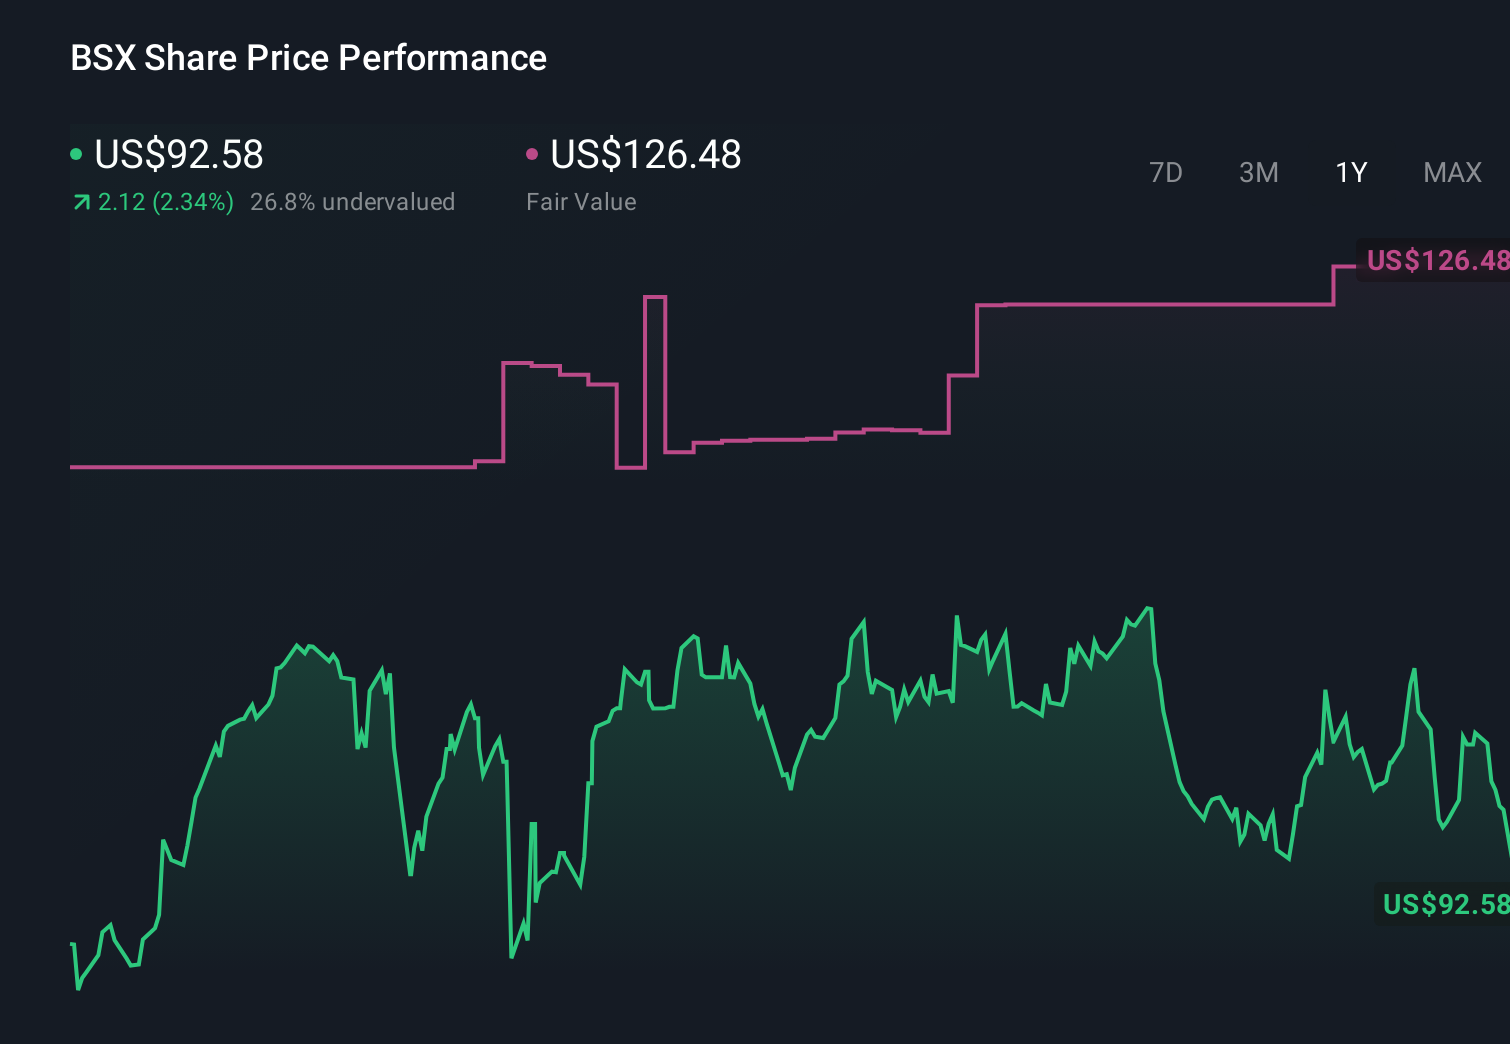
- The stock last closed at US$97.79, with returns of 1.9% over the past 7 days, 0.3% over the past 30 days, 3.3% year to date, 6.3% over 1 year, 112.3% over 3 years and 176.8% over 5 years.
- Recent company news has focused on Boston Scientific's position as a major medical devices player and its ongoing product portfolio in areas such as cardiology and other interventional procedures. This helps frame how investors think about future cash flows and growth potential. These themes often influence how the market responds to updates on clinical adoption, product launches or regulatory milestones, even when there is no earnings release in view.
- Boston Scientific currently has a value score of 1 out of 6. Next we will look at what different valuation approaches say about that number, before finishing with a way of looking at valuation that can tie all of these pieces together.
Boston Scientific scores just 1/6 on our valuation checks. See what other red flags we found in the full valuation breakdown.
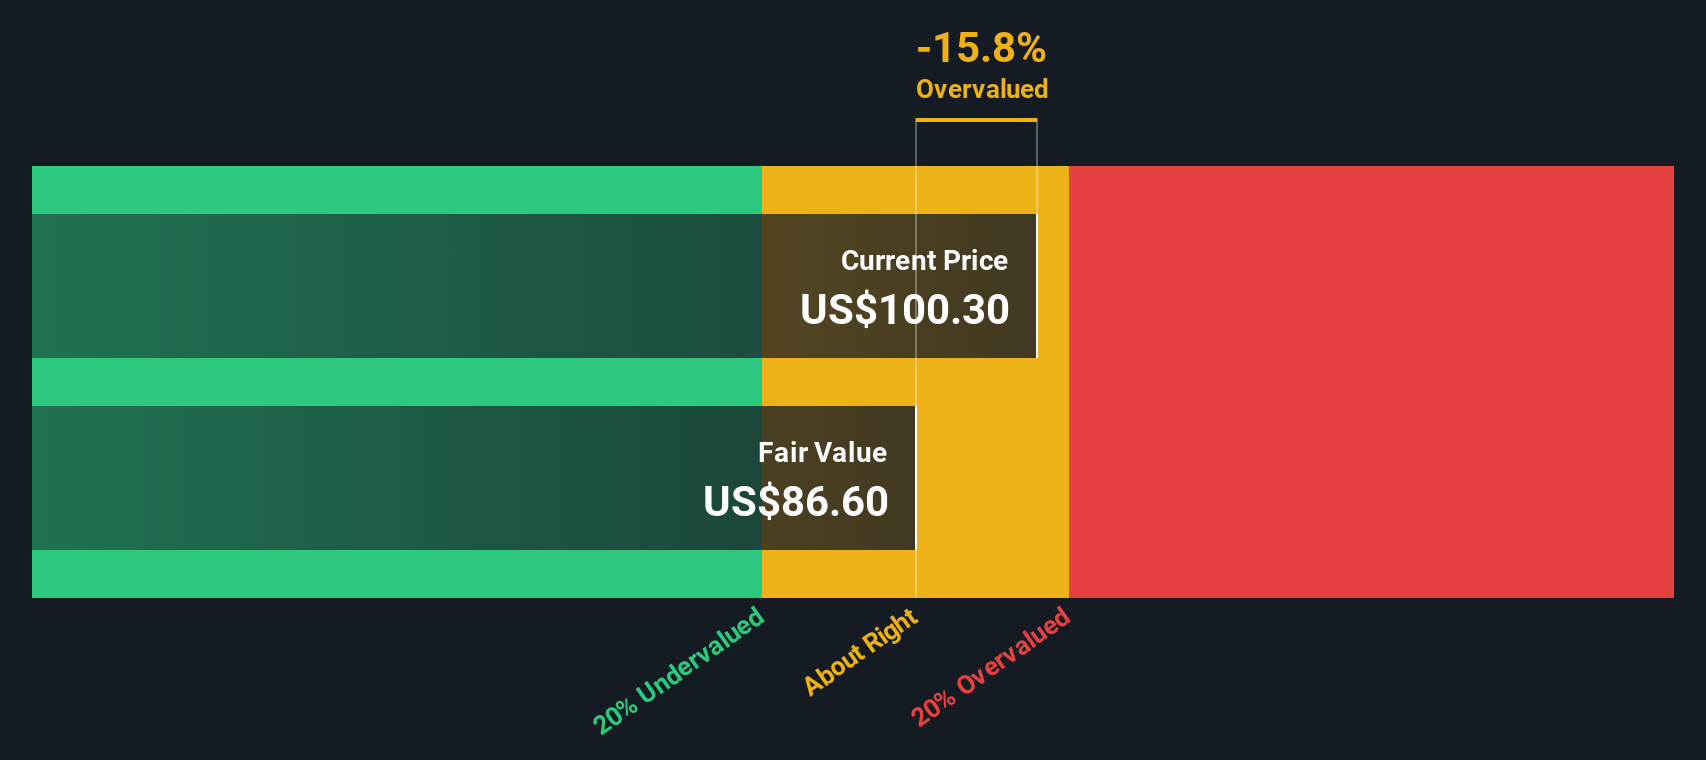
Approach 1: Boston Scientific Discounted Cash Flow (DCF) Analysis
A Discounted Cash Flow model takes estimates of the cash a company could generate in the future and discounts those amounts back to what they might be worth in today's dollars. It is a way of asking what you might reasonably pay now for those future cash flows.
For Boston Scientific, the model used is a 2 Stage Free Cash Flow to Equity approach. The company’s last twelve months Free Cash Flow is about $3.77b. Analysts provide specific projections up to 2027, with Free Cash Flow for 2027 estimated at $4.51b, and Simply Wall St then extrapolates cash flows out to 2035 using moderate growth assumptions each year.
When all those projected cash flows are discounted back, the DCF model suggests an intrinsic value of about $68.69 per share. Compared to the recent share price of $97.79, this indicates the stock is about 42.4% overvalued on this measure.
Result: OVERVALUED
Our Discounted Cash Flow (DCF) analysis suggests Boston Scientific may be overvalued by 42.4%. Discover 877 undervalued stocks or create your own screener to find better value opportunities.
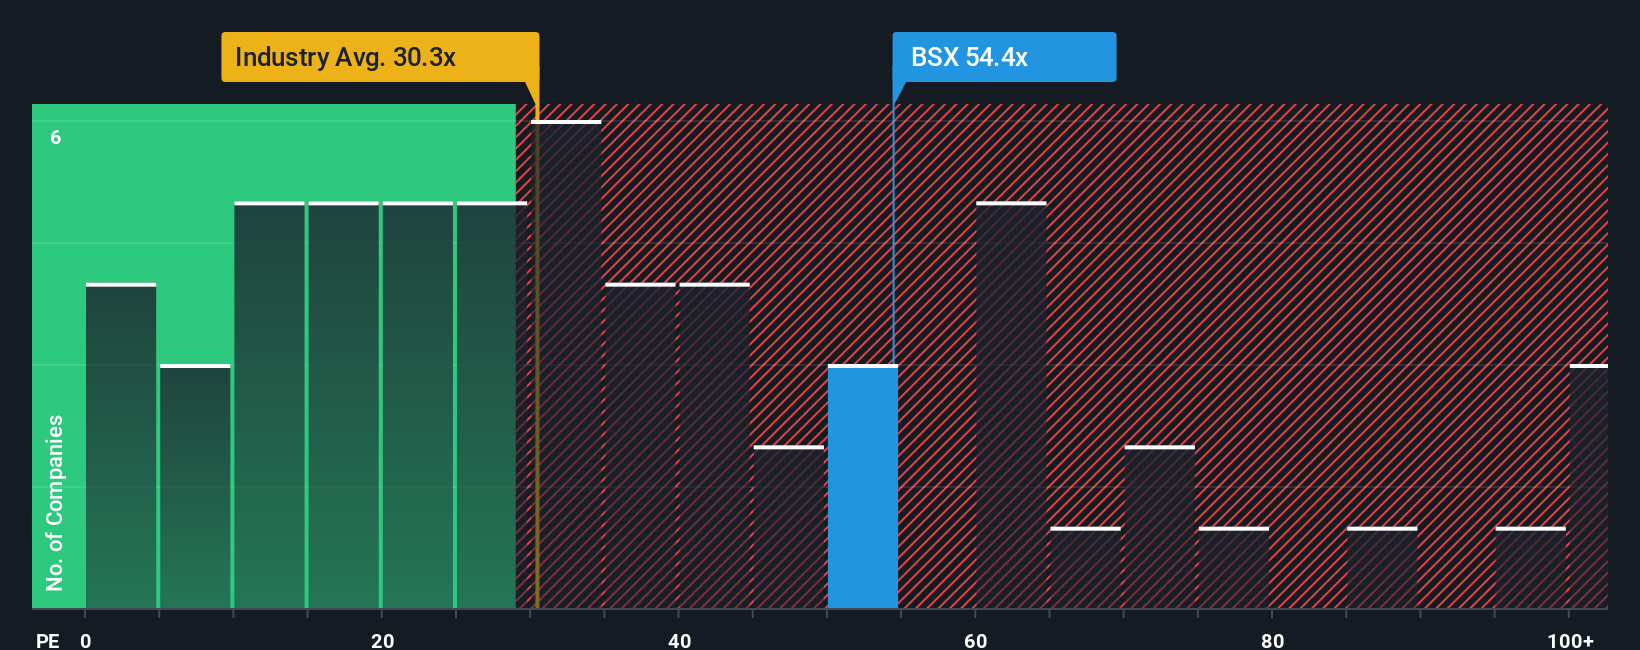
Approach 2: Boston Scientific Price vs Earnings
For a profitable company like Boston Scientific, the P/E ratio is a useful shorthand for what investors are currently paying for each dollar of earnings. It helps you see how the market is weighing the company’s earnings power relative to others.
What counts as a “normal” or “fair” P/E usually reflects how the market views a company’s earnings growth prospects and risk. Higher expected growth or lower perceived risk can support a higher multiple, while slower growth or higher risk tends to align with a lower one.
Boston Scientific currently trades on a P/E of 51.94x. That sits above both the Medical Equipment industry average of 30.65x and a peer group average of 41.77x. Simply Wall St’s Fair Ratio for Boston Scientific is 41.12x, which is its estimate of an appropriate P/E given factors such as earnings growth profile, industry, profit margins, market cap and company specific risks.
Compared with simple industry or peer comparisons, the Fair Ratio aims to be more tailored, since it adjusts for those company specific characteristics rather than applying a single sector yardstick.
With the current P/E of 51.94x versus a Fair Ratio of 41.12x, the stock screens as overvalued on this measure.
Result: OVERVALUED
P/E ratios tell one story, but what if the real opportunity lies elsewhere? Discover 1448 companies where insiders are betting big on explosive growth.
Upgrade Your Decision Making: Choose your Boston Scientific Narrative
Earlier we mentioned that there is an even better way to understand valuation. Let us introduce you to Narratives, which are simple stories you build around Boston Scientific that link your view of its products, growth drivers and risks to a set of revenue, earnings and margin forecasts. These forecasts are then turned into a fair value, which you can compare with the current price using an easy tool on Simply Wall St’s Community page that millions of investors use. Narratives automatically refresh when new earnings or news arrive. For example, one investor might build a more optimistic Boston Scientific Narrative that lines up with a fair value near US$140, while another might take a more cautious view closer to US$99. By seeing these side by side, you can decide how your own story compares and what that means for your next move.
Do you think there's more to the story for Boston Scientific? Head over to our Community to see what others are saying!
This article by Simply Wall St is general in nature. We provide commentary based on historical data and analyst forecasts only using an unbiased methodology and our articles are not intended to be financial advice. It does not constitute a recommendation to buy or sell any stock, and does not take account of your objectives, or your financial situation. We aim to bring you long-term focused analysis driven by fundamental data. Note that our analysis may not factor in the latest price-sensitive company announcements or qualitative material. Simply Wall St has no position in any stocks mentioned.
Have feedback on this article? Concerned about the content? Get in touch with us directly. Alternatively, email editorial-team@simplywallst.com