
 Nasdaq
 華爾街日報
華爾街日報Is Philips (ENXTAM:PHIA) Pricing Reflect Recent Product Issues And Future Cash Flow Potential
- If you are wondering whether Koninklijke Philips shares offer fair value or a potential bargain at around €24.45, you are not alone.
- The stock has returned 4.9% over the last week, 5.1% over the last month, 5.8% year to date and 3.8% over the past year, while the 3 year return sits at 78.9% and the 5 year return at a 34.6% decline. This gives a mixed picture that many investors are trying to make sense of.
- Recent headlines around Koninklijke Philips have focused on ongoing product related issues, regulatory scrutiny and the company working through legal and operational challenges, all of which influence how investors think about risk. At the same time, coverage has also highlighted management actions aimed at restructuring and refocusing the business. This helps explain why the share price has been sensitive to new developments.
- On our checks, Koninklijke Philips currently scores 2 out of 6 for potential undervaluation. Next, we will look at what different valuation methods say about the shares, before finishing with a simple way to pull all of those signals together.
Koninklijke Philips scores just 2/6 on our valuation checks. See what other red flags we found in the full valuation breakdown.
Approach 1: Koninklijke Philips Discounted Cash Flow (DCF) Analysis
A Discounted Cash Flow, or DCF, model estimates what a business might be worth today by projecting its future cash flows and then discounting those back to a present value.
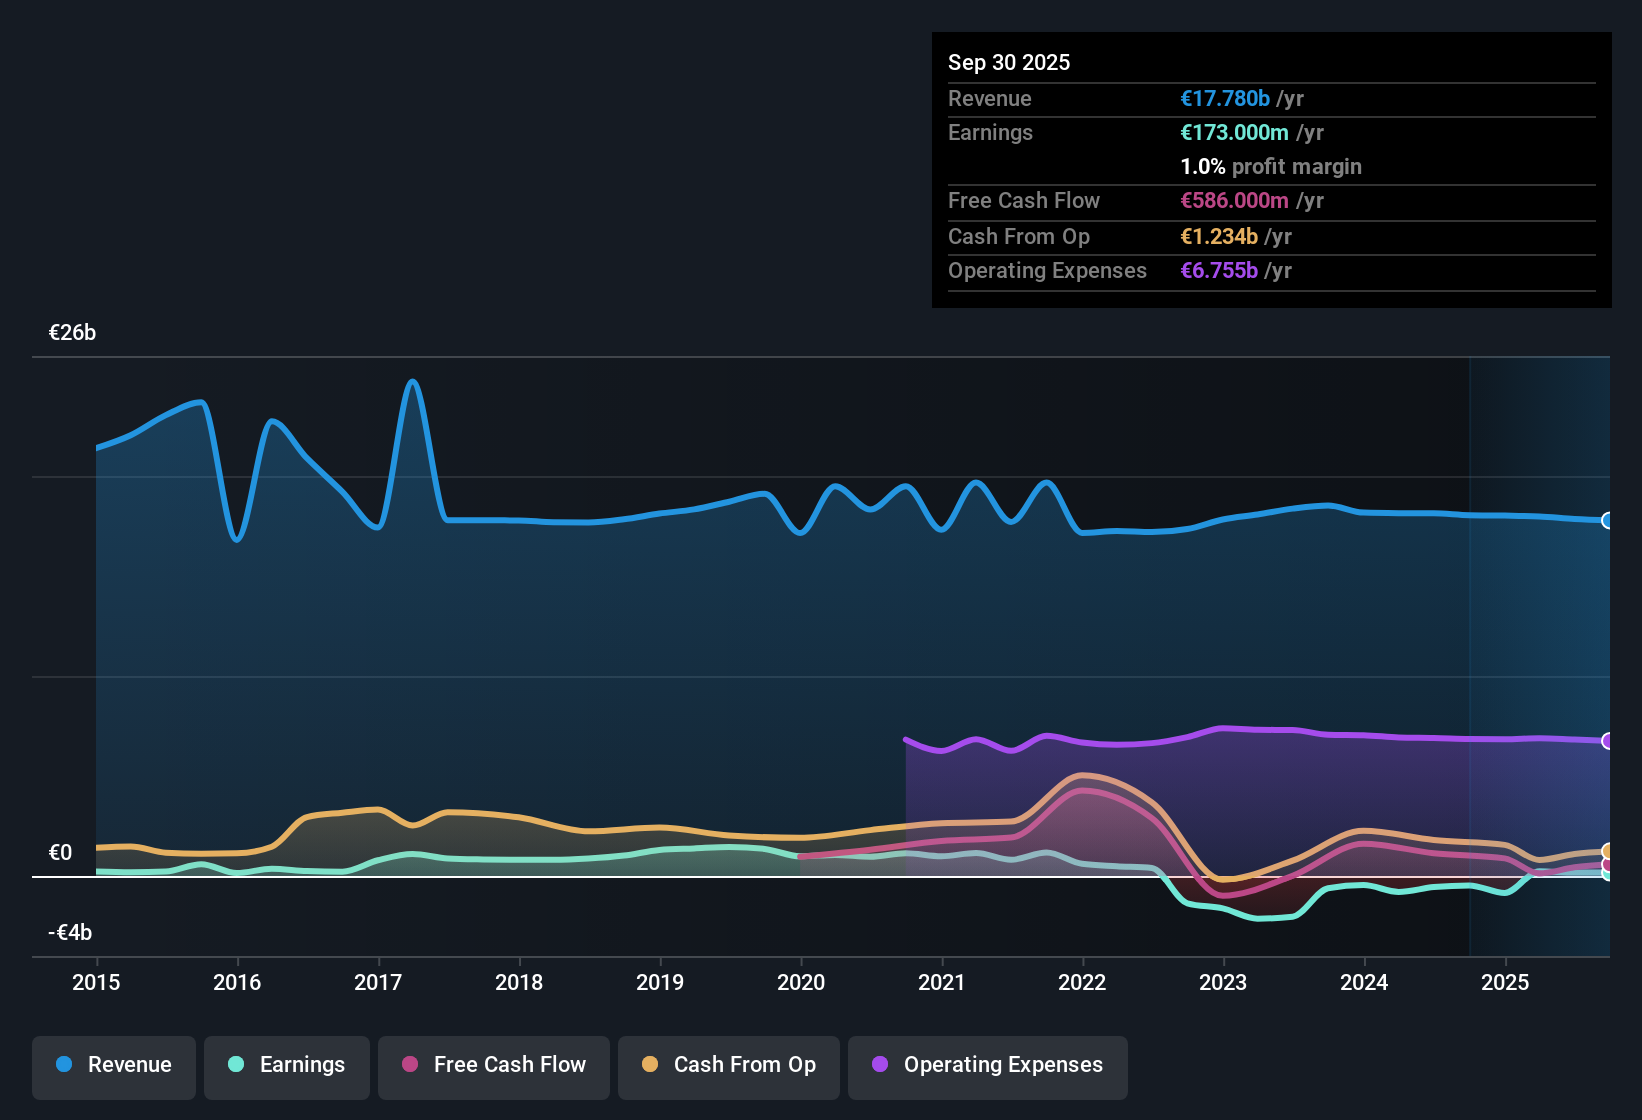
For Koninklijke Philips, the latest twelve month Free Cash Flow is about €574.3 million. Based on analyst inputs for the next few years and then extrapolations after that, cash flows are projected to reach around €1,882.55 million by 2030. Simply Wall St uses a 2 Stage Free Cash Flow to Equity model, which first applies analyst forecasts out to 2030, then extends those projections further using slower growth assumptions.
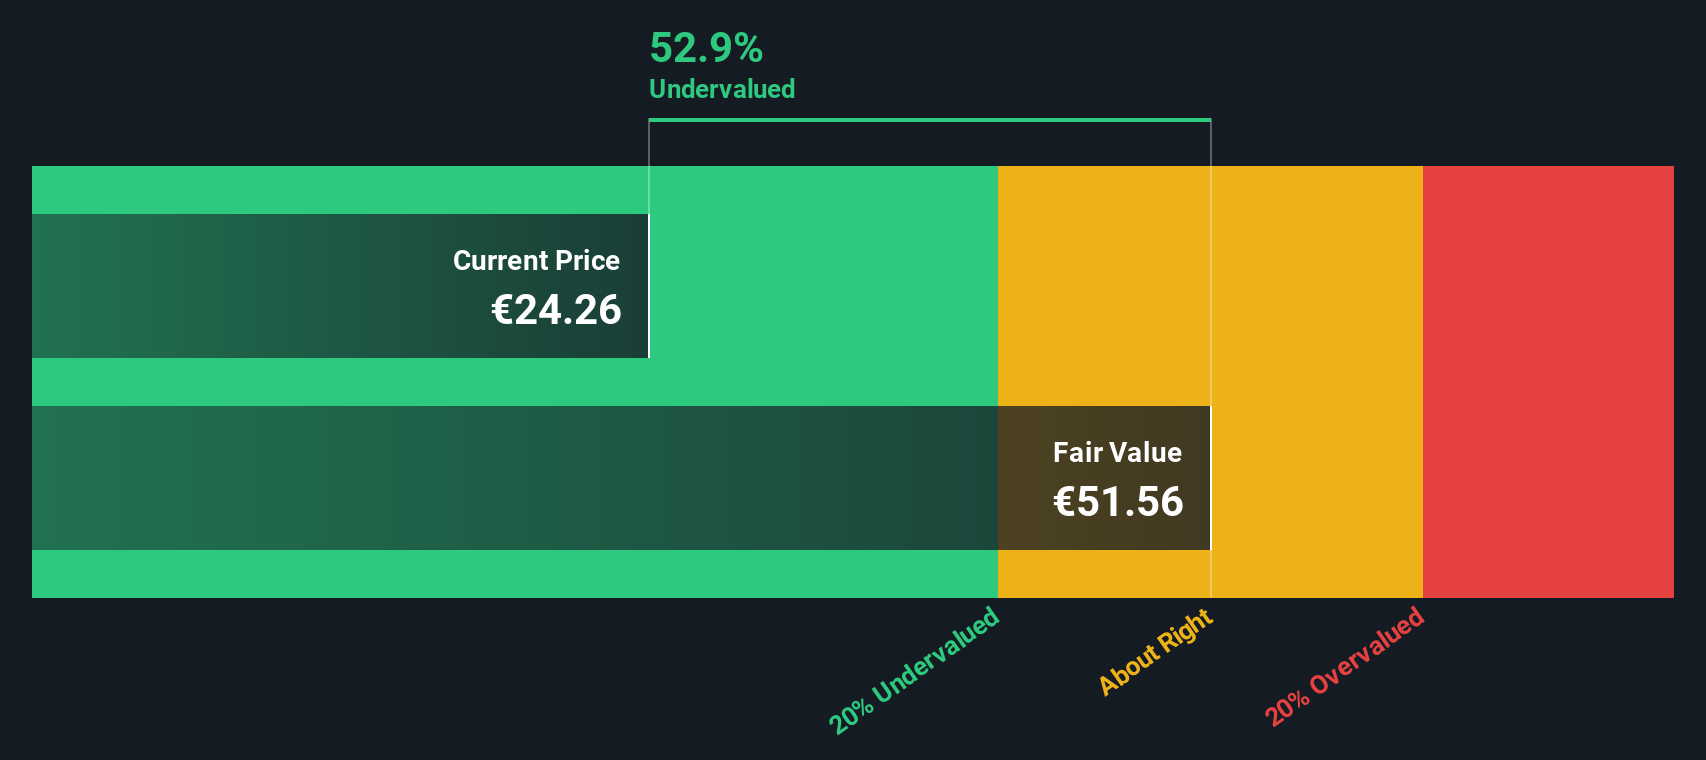
When all those projected cash flows are discounted back, the model arrives at an estimated intrinsic value of about €38.85 per share. Compared with the current share price around €24.45, this implies the stock trades at roughly a 37.1% discount to that DCF estimate. This indicates the shares may be undervalued on this measure alone.
Result: UNDERVALUED
Our Discounted Cash Flow (DCF) analysis suggests Koninklijke Philips is undervalued by 37.1%. Track this in your watchlist or portfolio, or discover 877 more undervalued stocks based on cash flows.
Approach 2: Koninklijke Philips Price vs Earnings
The P/E ratio is a common way to look at valuation for profitable companies, because it links what you pay for each share to the earnings that the business is currently generating. It gives you a quick sense of how much investors are willing to pay for each €1 of earnings.
What counts as a "normal" P/E depends a lot on how the market views growth potential and risk. Higher expected growth or lower perceived risk can justify a higher P/E, while lower growth expectations or higher risk usually go with a lower P/E.
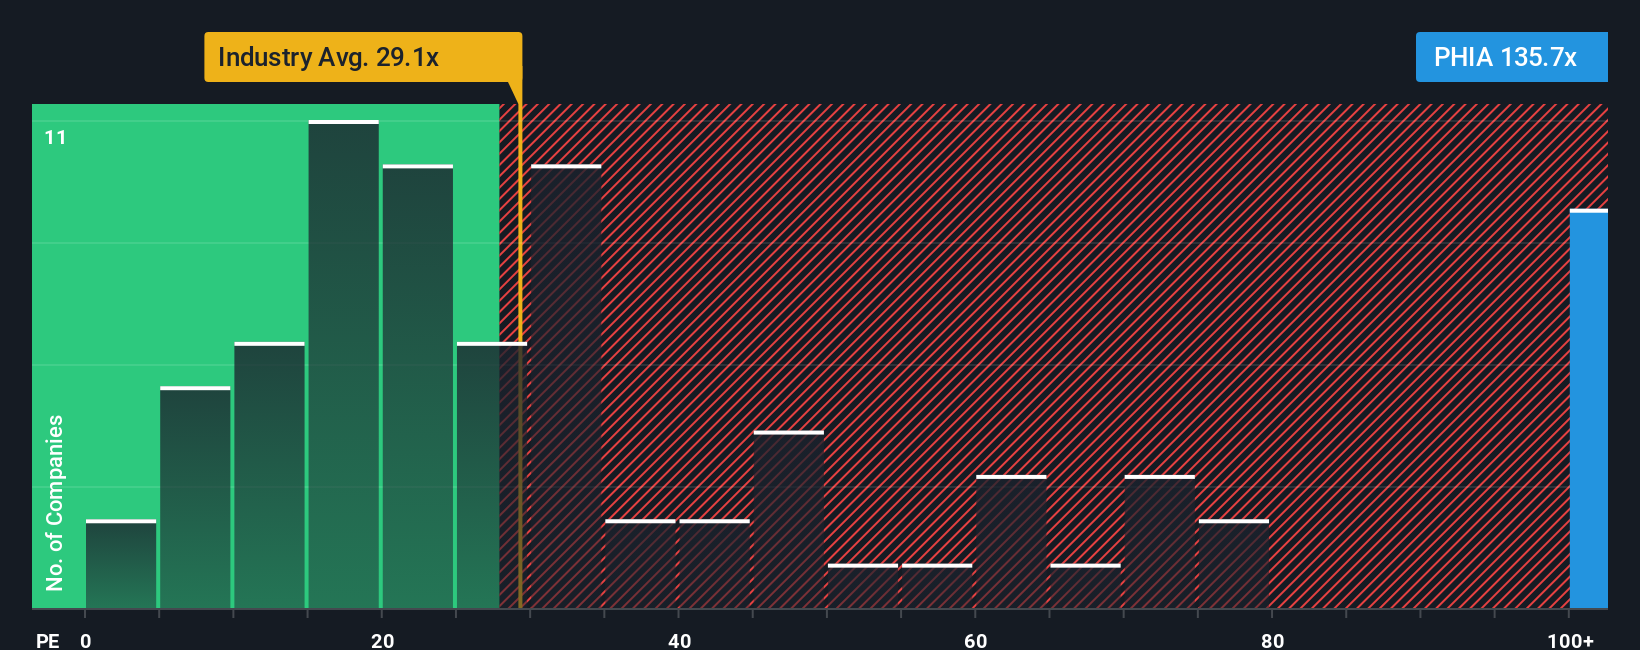
Koninklijke Philips is trading on a P/E of about 134.40x. That is well above the Medical Equipment industry average of roughly 28.27x and the peer group average of around 34.77x. Simply Wall St also uses a proprietary "Fair Ratio" for P/E, which is the multiple it would expect for a company with Koninklijke Philips’ earnings growth profile, industry, profit margins, market cap and risk factors. This is more tailored than a simple comparison with industry or peers, because it adjusts for those company specific inputs rather than treating all firms as equal. In this case, the current P/E is higher than the Fair Ratio output, which points to the shares looking expensive on this metric.
Result: OVERVALUED
P/E ratios tell one story, but what if the real opportunity lies elsewhere? Discover 1448 companies where insiders are betting big on explosive growth.
Upgrade Your Decision Making: Choose your Koninklijke Philips Narrative
Earlier we mentioned that there is an even better way to understand valuation, so let us introduce you to Narratives, which are simply your story about Koninklijke Philips linked directly to your own assumptions about fair value, future revenue, earnings and margins.
Instead of only relying on ratios like P/E, a Narrative helps you connect what you believe about the company, such as how it handles its product issues or restructuring efforts, to a financial forecast and then to a fair value that you can compare with the current price.
On Simply Wall St, within the Community page used by millions of investors, Narratives are an accessible tool that lets you set your expectations, see the implied fair value, and quickly check whether that sits above or below today’s share price, which can inform your investment decisions.
Narratives also refresh as new news or earnings data is added, and you might see one investor expecting a much higher fair value for Koninklijke Philips than another investor who assumes a much lower figure, even though they are both looking at the same company.
Do you think there's more to the story for Koninklijke Philips? Head over to our Community to see what others are saying!
This article by Simply Wall St is general in nature. We provide commentary based on historical data and analyst forecasts only using an unbiased methodology and our articles are not intended to be financial advice. It does not constitute a recommendation to buy or sell any stock, and does not take account of your objectives, or your financial situation. We aim to bring you long-term focused analysis driven by fundamental data. Note that our analysis may not factor in the latest price-sensitive company announcements or qualitative material. Simply Wall St has no position in any stocks mentioned.
Have feedback on this article? Concerned about the content? Get in touch with us directly. Alternatively, email editorial-team@simplywallst.com