
 Nasdaq
 華爾街日報
華爾街日報Is AT&T (T) Offering Value After Recent Share Price Weakness
- If you are wondering whether AT&T's share price lines up with its fundamentals, this article walks through the key numbers so you can judge the value case for yourself.
- AT&T's stock last closed at US$24.34, with a 7 day return of 1.9% decline, a 30 day return of 3.7% decline, a year to date return of 0.9% decline, and a 1 year return of 14.5%.
- Over longer periods, the stock shows a 3 year return of 45.9% and a 5 year return of 49.5%, which helps frame how the current price sits against past investor outcomes. These figures give useful context when thinking about whether today's valuation looks stretched or still leaves room on the table.
- On our checks, AT&T scores a 6/6 valuation score, and next we will look at how different valuation methods line up on the stock, before finishing with a simpler way to think about what that valuation means for you.
Find out why AT&T's 14.5% return over the last year is lagging behind its peers.
Approach 1: AT&T Discounted Cash Flow (DCF) Analysis
A Discounted Cash Flow model estimates what a company could be worth by projecting its future cash flows and then discounting those back to today, using a required rate of return. It is essentially asking what all future cash generated is worth in today's dollars.
For AT&T, the model uses a 2 Stage Free Cash Flow to Equity approach. The company last reported trailing twelve month free cash flow of about US$21.8b. Analyst and extrapolated projections suggest free cash flow of US$18.2b in 2026 and US$21.6b by 2030, with later years extended by Simply Wall St based on the earlier estimates.
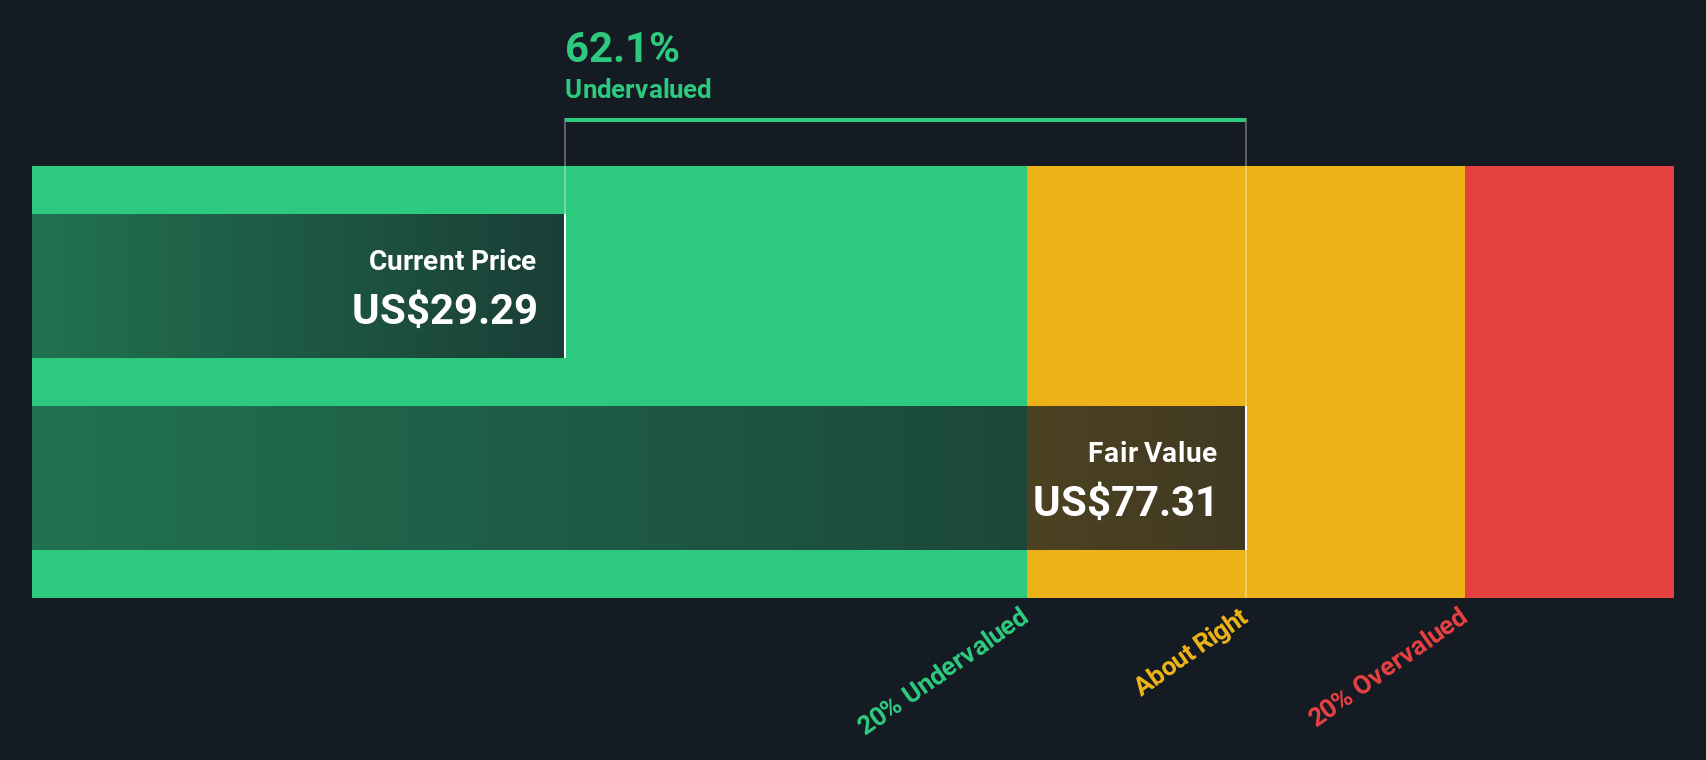
When all projected cash flows are discounted back and combined, the DCF model arrives at an estimated intrinsic value of US$54.70 per share. Compared with the recent share price of US$24.34, this implies the stock is about 55.5% undervalued according to this method.
On this model, AT&T's current price is well below the DCF estimate.
Result: UNDERVALUED
Our Discounted Cash Flow (DCF) analysis suggests AT&T is undervalued by 55.5%. Track this in your watchlist or portfolio, or discover 877 more undervalued stocks based on cash flows.
Approach 2: AT&T Price vs Earnings
For a profitable business like AT&T, the P/E ratio is a useful shorthand for what the market is paying for each dollar of earnings. It ties the share price directly to current profits, which is usually what drives long term returns for shareholders.
What counts as a reasonable P/E depends on what investors expect for growth and how risky they see those earnings. Higher expected growth or lower perceived risk can justify a higher P/E, while slower growth or higher risk typically comes with a lower P/E.
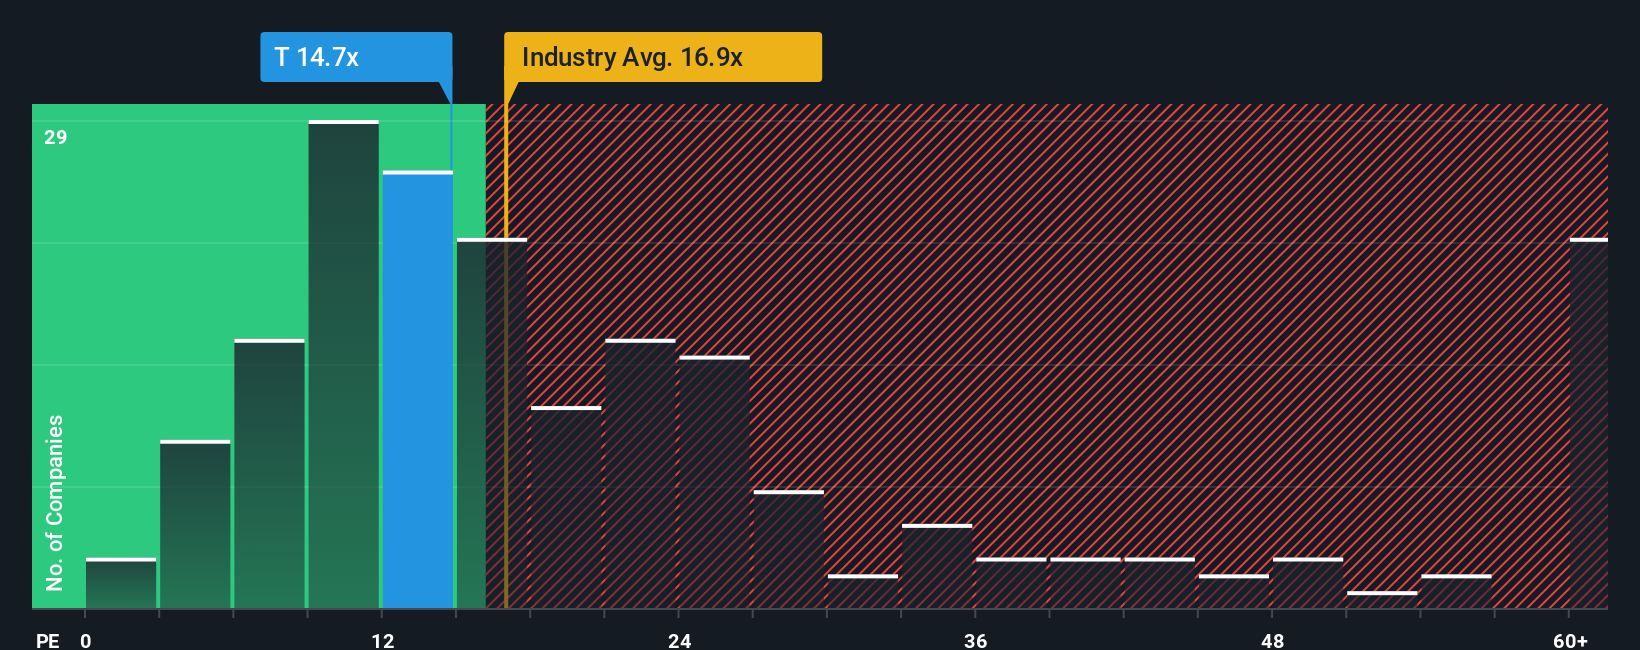
AT&T currently trades on a P/E of 7.78x. That sits below the Telecom industry average P/E of 16.36x and also below the peer group average of 8.43x. Simply Wall St also calculates a “Fair Ratio” of 12.39x for AT&T. This is a proprietary estimate of the P/E that might be reasonable given factors such as the company’s earnings profile, its industry, profit margins, market cap and key risks.
The Fair Ratio can be more informative than a simple peer or industry comparison because it attempts to adjust for differences in growth, risk and profitability rather than assuming all Telecom companies deserve the same multiple.
Since AT&T’s current P/E of 7.78x is below the Fair Ratio of 12.39x, the shares appear inexpensive on this metric.
Result: UNDERVALUED
P/E ratios tell one story, but what if the real opportunity lies elsewhere? Discover 1449 companies where insiders are betting big on explosive growth.
Upgrade Your Decision Making: Choose your AT&T Narrative
Earlier we mentioned that there is an even better way to understand valuation, so let us introduce you to Narratives, which are simply your story about a company linked directly to your own forecast for its revenue, earnings, margins and fair value, all handled inside the Simply Wall St Community page that millions of investors already use.
Instead of only looking at a single DCF or P/E number, a Narrative lets you connect what you think is happening at AT&T, such as fiber and 5G build out, cost cuts, competition or legal issues, to explicit assumptions about future revenue, profit margins, discount rates and P/E, and then into a fair value that you can compare with today’s share price.
Because Narratives on the platform update when fresh information like earnings, news or analyst targets comes through, you can see in real time how a more optimistic view that points to a fair value around US$31.46 and a more cautious view closer to US$21.87 both map back to different assumptions, and you can then use that range to decide for yourself whether AT&T looks closer to a buy, a hold, or a sell at the current market price.
Do you think there's more to the story for AT&T? Head over to our Community to see what others are saying!

This article by Simply Wall St is general in nature. We provide commentary based on historical data and analyst forecasts only using an unbiased methodology and our articles are not intended to be financial advice. It does not constitute a recommendation to buy or sell any stock, and does not take account of your objectives, or your financial situation. We aim to bring you long-term focused analysis driven by fundamental data. Note that our analysis may not factor in the latest price-sensitive company announcements or qualitative material. Simply Wall St has no position in any stocks mentioned.
Have feedback on this article? Concerned about the content? Get in touch with us directly. Alternatively, email editorial-team@simplywallst.com