
 Nasdaq
 華爾街日報
華爾街日報Is McCormick (MKC) Pricing Look Compelling After Recent Share Price Weakness
- If you are looking at McCormick and wondering whether the current price really reflects its value, this article will walk you through what the numbers are actually saying.
- The stock last closed at US$66.35, with recent returns showing a 3.1% decline over 7 days, a 4.8% gain over 30 days, and returns of 1.4% decline year to date, 8.4% decline over 1 year, 15.7% decline over 3 years and 20.4% decline over 5 years.
- These mixed returns have kept McCormick in focus for investors who are reassessing how much they are willing to pay for stable, branded consumer names. Recent attention on established consumer staples companies, together with ongoing debates about valuations across the sector, provides useful context for how the market is currently pricing McCormick.
- Right now, McCormick has a valuation score of 2 out of 6, which means it screens as undervalued on 2 of 6 checks, and we will look at what that implies across different valuation methods before finishing with a more complete way to think about what the stock could be worth to you.
McCormick scores just 2/6 on our valuation checks. See what other red flags we found in the full valuation breakdown.
Approach 1: McCormick Discounted Cash Flow (DCF) Analysis
A Discounted Cash Flow, or DCF, model estimates what a business could be worth by projecting its future cash flows and then discounting those back to today using a required return. It is essentially asking what all of McCormick’s future cash generation is worth in today’s dollars.
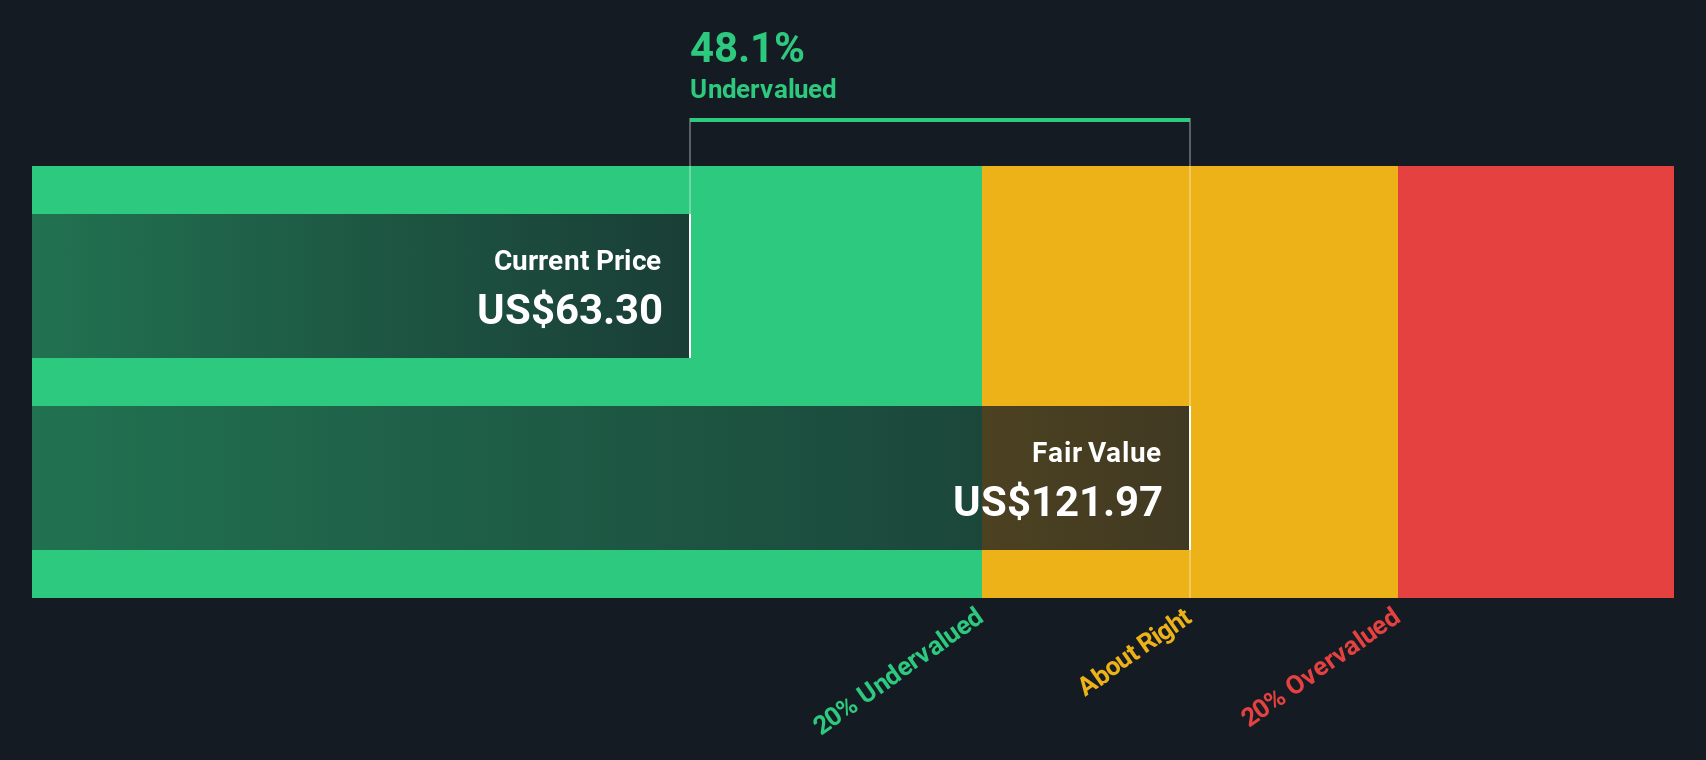
For McCormick, the model used is a 2 Stage Free Cash Flow to Equity approach. The latest twelve month Free Cash Flow is about $617.8 million. Analyst style projections, combined with Simply Wall St extrapolations, suggest free cash flow figures in the hundreds of millions over the next decade, reaching a projected $2,293.7 million in 2035, all expressed in US$ terms.
After discounting these projected cash flows back to today, the DCF model arrives at an estimated intrinsic value of about $164.28 per share. Compared with the recent share price of $66.35, this suggests the stock screens as materially undervalued based on this method, with an intrinsic discount of around 59.6%.
Result: UNDERVALUED
Our Discounted Cash Flow (DCF) analysis suggests McCormick is undervalued by 59.6%. Track this in your watchlist or portfolio, or discover 877 more undervalued stocks based on cash flows.
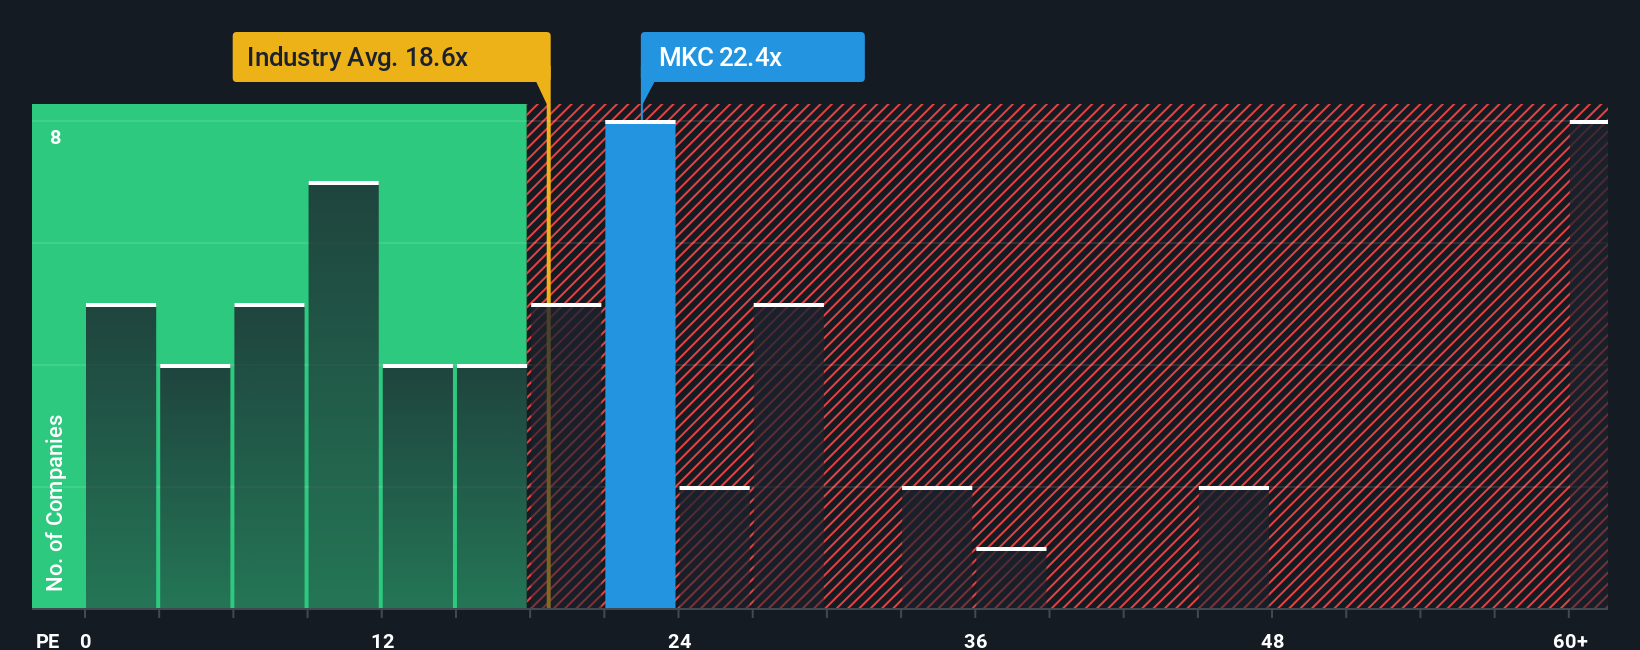
Approach 2: McCormick Price vs Earnings
For a profitable business like McCormick, the P/E ratio is a useful way to think about what you are paying for each dollar of earnings. In general, investors tend to accept a higher P/E when they expect stronger earnings growth or see less risk, and a lower P/E when growth expectations are muted or risks feel higher.
McCormick currently trades on a P/E of 22.89x. That sits above the Food industry average P/E of 19.84x and also above the peer group average of 21.12x, so on simple comparisons the shares look relatively more expensive than many listed food companies.
Simply Wall St’s Fair Ratio for McCormick is 18.08x. This is a proprietary estimate of what a “normal” P/E might look like for the company after considering its earnings growth profile, profit margins, risk factors, market capitalization and its industry. Because it blends these company specific drivers, it can be more informative than just lining McCormick up next to peers or the broad industry. Comparing the Fair Ratio of 18.08x with the actual P/E of 22.89x suggests the market is currently pricing McCormick above this fair multiple.
Result: OVERVALUED
P/E ratios tell one story, but what if the real opportunity lies elsewhere? Discover 1449 companies where insiders are betting big on explosive growth.
Upgrade Your Decision Making: Choose your McCormick Narrative
Earlier we mentioned that there is an even better way to understand valuation. Let us introduce you to Narratives, an approach on Simply Wall St’s Community page that lets you tell your story about McCormick by linking your assumptions for future revenue, earnings, margins and fair value to a clear forecast. You can then compare that Fair Value with today’s price. It updates automatically when new news or earnings land.
For McCormick, one investor might build a bullish Narrative around the US$102.0 analyst target with expectations for stronger margin recovery and a higher future P/E of 26.5x. Another investor might anchor on the US$67.0 target with a more cautious view on tariffs, costs and valuation. Narratives makes it easy to see which version of the story you agree with and how that translates into your own view of what the shares are worth.
Do you think there's more to the story for McCormick? Head over to our Community to see what others are saying!

This article by Simply Wall St is general in nature. We provide commentary based on historical data and analyst forecasts only using an unbiased methodology and our articles are not intended to be financial advice. It does not constitute a recommendation to buy or sell any stock, and does not take account of your objectives, or your financial situation. We aim to bring you long-term focused analysis driven by fundamental data. Note that our analysis may not factor in the latest price-sensitive company announcements or qualitative material. Simply Wall St has no position in any stocks mentioned.
Have feedback on this article? Concerned about the content? Get in touch with us directly. Alternatively, email editorial-team@simplywallst.com